用R语言 画条形图(基于ggplot2包)
时间:2015-03-02 16:47:38
收藏:0
阅读:1895
1.用qplot(x,data=data,geom.=”bar”,weight=y)+scale_y_continuous("y")画出y关于x的条形。
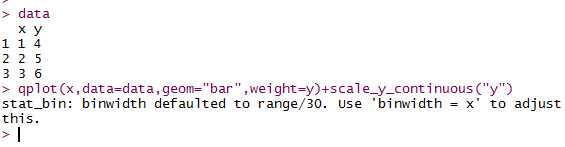
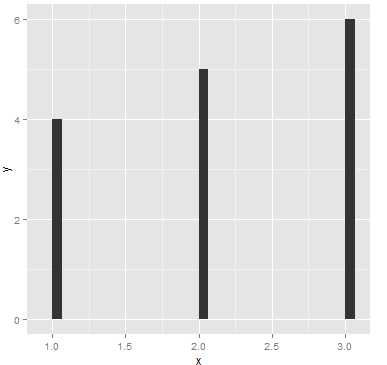
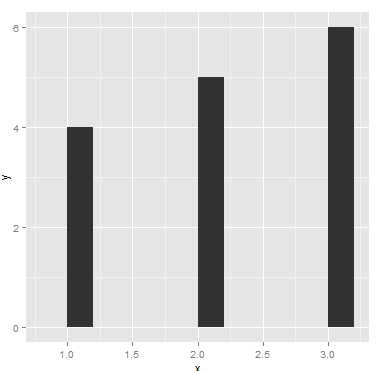
图中提示binwidth这里是指矩形的宽度,指定之后如下
qplot(x,data=data,geom="bar",weight=y,binwidth=0.2)+scale_y_continuous("y")
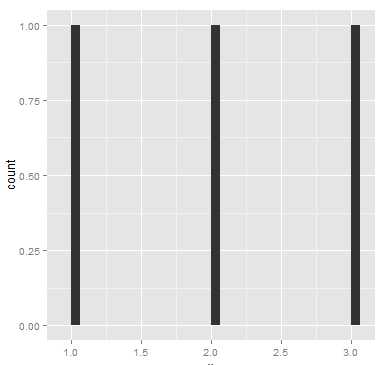
2.用qplot(x,data=data,geom.=”bar”)画出来的是频率直方图,反映的是单维变量
评论(0)