ELK7.11.2版本安装部署及ElastAlert告警相关配置
文档开篇,我还是要说一遍,虽然我在文档内容中也会说好多遍,但是希望大家不要嫌我墨迹:
请多看官方文档,请多看命令行报错信息,请多看日志信息,很多时候它们比百度、比必应、比谷歌有用;
请不要嫌麻烦,打开你的谷歌翻译,去看看英文的文档,虽然它没有中文,虽然你直接看不懂,但它可能是最后帮你真正解决问题的那位;
(翻译软件很多,要记得使用,整体页面翻译我一般是谷歌浏览器或者WIN10升级的新Edge,最近发现页面整体翻译有时候Edge比谷歌好,谷歌页面翻译居然把代码都翻译了,看的不明不白的)
(文字颜色说明:灰色是注释和一些说明的内容,基本上带 # 的都是; 绿色是一些命令行打印信息和文件内容; 黄色底色的是一些注意事项,可能在你遇到问题时帮你起到一个分析引导的作用)
尝试安装了ELK的6.6.1、7.6.1和7.11.2这三个版本,方法步骤全都一样,这里以我当前使用的7.11.2做示例;
除了要求的jdk版本以外,全都一样的,当然仅限安装步骤,配置文件的细节之处还是有不同之处的;
配置文件我会分为两部分,一部分是安装通用的,另一部分是个人仅在7.11.2上进行调试的日志获取及索引的一些配置,其他版本不确定,我会标记出来,避免误导;
本人当前使用的是Elasticsearch + Kibana + filebeat直接索引分类 + ElastAlert报警到钉钉;
好处是结构简单,部署方便,内存占用相对低;
若你也想用这个结构,依次查看 1(filebeat数据集成部分跳过) --> 3 --> 4 --> 5 部分即可;
内容索引: ---> 1、安装部署及文件配置
---> 2、配置logstash为多个日志来源分别设置索引
---> 3、不使用logstash,而是设置filebeat来为多个日志分别设置索引
---> 5、ElastAlert规则配置文件编写及调试说明
---> 6、ElastAlert安装及使用中遇到的报错问题
---> 7、Kibana提示许可过期,不能对索引等功能进行操作
---> 8、Elasticsearch与Kibana之间开启TLS以满足“告警和操作”的设置环境(商用功能)
安装部署及文件配置
官方下载地址:https://www.elastic.co/cn/downloads/past-releases#elasticsearch
请选择相应的版本进行安装,软件尽量都下载相同版本进行安装部署:
[root@localhost ~]# ls -ls *.rpm
315352 -rw-r--r-- 1 root root 322917736 Mar 31 04:53 elasticsearch-7.11.2-x86_64.rpm
 33512 -rw-r--r-- 1 root root  34316071 Mar 31 05:44 filebeat-7.11.2-x86_64.rpm
249492 -rw-r--r-- 1 root root 255479673 Mar 31 04:52 kibana-7.11.2-x86_64.rpm
358580 -rw-r--r-- 1 root root 367185271 Mar 31 04:53 logstash-7.11.2-x86_64.rpm
相应的我们需要解决环境服务等依赖关系,这里说一下关于jdk的问题:
Unrecognized VM option ‘UseParNewGC‘ Error: Could not create the Java Virtua ...
这个报错网上找的解释是新的 java-11-openjdk 废弃了一个命令导致 ELK6.6.1 版本不能使用该环境,只支持到9版本,相应的可以安装 java-1.6.0-openjdk ;
我目前安装的 7.11.2 版本可以直接安装 java-11-openjdk 或 java-1.8.0-openjdk ;
    ##安装jdk
[root@localhost ~]# yum install -y java-11-openjdk
    ##看下java版本,没问题
[root@localhost ~]# java -version
openjdk version "11.0.10" 2021-01-19 LTS
OpenJDK Runtime Environment 18.9 (build 11.0.10+9-LTS)
OpenJDK 64-Bit Server VM 18.9 (build 11.0.10+9-LTS, mixed mode, sharing)

    ##记得同步时间
[root@localhost ~]# yum install -y ntpdate
    ##服务器没有时间同步可以加到 /etc/rc.local 中
[root@localhost ~]# /usr/sbin/ntpdate ntp.aliyun.com
之后我们就可以使用rpm包直接进行安装了,非常简单方便:
    ##导入GPG密钥,如果不能在线导入,用这个http地址在浏览器把密钥下载下来,然后本地导入,URL换成路径文件即可
[root@localhost ~]# rpm --import https://artifacts.elastic.co/GPG-KEY-elasticsearch

    ##安装rpm软件包
[root@localhost ~]# rpm -ivh elasticsearch-7.11.2-x86_64.rpm logstash-7.11.2-x86_64.rpm kibana-7.11.2-x86_64.rpm filebeat-7.11.2-x86_64.rpm
warning: elasticsearch-7.11.2-x86_64.rpm: Header V4 RSA/SHA512 Signature, key ID d88e42b4: NOKEY
Preparing...                          ################################# [100%]
Updating / installing...
   1:filebeat-7.11.2-1                ################################# [ 25%]
   2:kibana-7.11.2-1                  ################################# [ 50%]
Creating kibana group... OK
Creating kibana user... OK
   3:logstash-1:7.11.2-1              ################################# [ 75%]
Using bundled JDK: /usr/share/logstash/jdk
Using provided startup.options file: /etc/logstash/startup.options
OpenJDK 64-Bit Server VM warning: Option UseConcMarkSweepGC was deprecated in version 9.0 and will likely be removed in a future release.
/usr/share/logstash/vendor/bundle/jruby/2.5.0/gems/pleaserun-0.0.31/lib/pleaserun/platform/base.rb:112: warning: constant ::Fixnum is deprecated
Successfully created system startup script for Logstash
Creating elasticsearch group... OK
Creating elasticsearch user... OK
   4:elasticsearch-0:7.11.2-1         ################################# [100%]
### NOT starting on installation, please execute the following statements to configure elasticsearch service to start automatically using systemd
 sudo systemctl daemon-reload
 sudo systemctl enable elasticsearch.service
### You can start elasticsearch service by executing
 sudo systemctl start elasticsearch.service
Created Kibana keystore in /etc/kibana/kibana.keystore
Created elasticsearch keystore in /etc/elasticsearch/elasticsearch.keystore
这里注意一下在安装Logstash时下面弹出的提示:OpenJDK 64-Bit Server VM warning: If the number of processors .. ,该提示说明你当前的虚拟机处理器的处理器核心数量不足,我们可以将VMware虚拟机的物理配置修改一下:
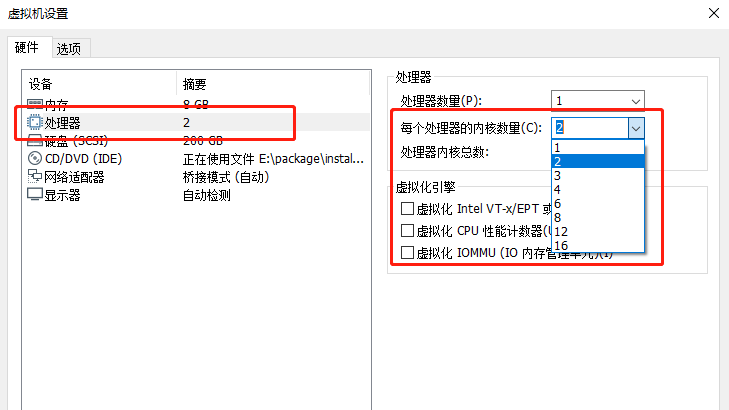
接下来我们进行配置:
注意:行号是我配置文件的位置,默认位置是这样,若你的配置文件有改动可能会不一样,这里做一个标识,方便修改;
Elasticsearch:
[root@localhost ~]# vim /etc/elasticsearch/elasticsearch.yml
    ##打开注释,集群名称和节点名称都是可以自己进行设定的
 17 cluster.name: my-application
 23 node.name: node-1

    ##数据文件及日志文件的路径,可以使用默认的 /var 下路径,若自己进行了其他位置的配置需要创建文件夹并正确授权,配置完配置文件,后面我有写步骤
 33 path.data: /opt/elasticsearch/date
 37 path.logs: /opt/elasticsearch/log

    ##配置绑定的网络地址,127是绑定本地,相应的,kibana和logstash是同一主机才可进行访问,若不同主机,要配置为elasticsearch自己主机的IP地址,使其他主机上的服务可以进行访问,端口默认9200
 55 network.host: 127.0.0.1
 59 http.port: 9200

    ##开启x-pack的安全功能
 89 xpack.security.enabled: true
 90 xpack.security.transport.ssl.enabled: true
 91 cluster.initial_master_nodes: ["node-1"]
若我们自己配置了数据文件及日志目录,需要创建目录并相应授权:
    ##根据实际需要,我们创建目录,这里我就暂时放 opt 下了
[root@localhost ~]# mkdir -pv /opt/elasticsearch/date
mkdir: created directory ‘/opt/elasticsearch’
mkdir: created directory ‘/opt/elasticsearch/date’
[root@localhost ~]# mkdir -pv /opt/elasticsearch/log
mkdir: created directory ‘/opt/elasticsearch/log’

    ##目录需要有相应的权限才能正常使用,需要注意的是,目录需要有gid权限
[root@localhost ~]# cd /opt/elasticsearch/
[root@localhost elasticsearch]# chmod 750 *
[root@localhost elasticsearch]# chmod g+s *
[root@localhost elasticsearch]# chown elasticsearch:elasticsearch *
[root@localhost elasticsearch]# ll
total 0
drwxr-s--- 2 elasticsearch elasticsearch 6 Apr  3 14:12 date
drwxr-s--- 2 elasticsearch elasticsearch 6 Apr  3 14:12 log
之后,配置是开启x-pack插件的,所以我们需要对一些默认的内置用户做一些调整:
    ##必须启动elasticsearch才能使用
[root@localhost ~]# systemctl start elasticsearch

    ##进行内置用户的密码设置,此处为了省事,我把密码设定与用户相同,实际情况根据需要来自行设定
[root@localhost ~]# /usr/share/elasticsearch/bin/elasticsearch-setup-passwords interactive
Initiating the setup of passwords for reserved users elastic,apm_system,kibana,kibana_system,logstash_system,beats_system,remote_monitoring_user.
You will be prompted to enter passwords as the process progresses.
Please confirm that you would like to continue [y/N]y


Enter password for [elastic]:
Reenter password for [elastic]:
Enter password for [apm_system]:
Reenter password for [apm_system]:
Enter password for [kibana_system]:
Reenter password for [kibana_system]:
Enter password for [logstash_system]:
Reenter password for [logstash_system]:
Enter password for [beats_system]:
Reenter password for [beats_system]:
Enter password for [remote_monitoring_user]:
Reenter password for [remote_monitoring_user]:
Changed password for user [apm_system]
Changed password for user [kibana_system]
Changed password for user [kibana]
Changed password for user [logstash_system]
Changed password for user [beats_system]
Changed password for user [remote_monitoring_user]
Changed password for user [elastic]
Kibana:
[root@localhost ~]# vim /etc/kibana/kibana.yml

    ##端口默认5601
  2 server.port: 5601

    ##绑定地址,这里暂时用0.0.0.0,是允许所有地址进行访问的,但是目前配置我们是加了x-pack的认证登录的,若还需要nginx的代理认证,需要改为127.0.0.1,仅允许本机访问
  7 server.host: "0.0.0.0"

    ##连接的elasticsearch,本地可以localhost,对应的是elasticsearch设置了127.0.0.1,若是设定的IP地址,则这里也需要改为对应的IP地址
 32 elasticsearch.hosts: ["http://localhost:9200"]

    ##kibana索引设置
 36 kibana.index: ".kibana"

    ##之前我们设置号的kibana用户和密码
 45 elasticsearch.username: "kibana_system"
 46 elasticsearch.password: "kibana_system"

    ##界面语言改成中文,默认的en是英文
111 i18n.locale: "zh-CN"
logstash:
[root@localhost ~]# vim /etc/logstash/logstash.yml

    ##默认127.0.0.1,仅允许本机访问,我们之后会有不同的主机采集日志,所以设置为0.0.0.0,允许访问
231 http.host: "0.0.0.0"

    ##端口默认即可,但是需要打开注释
236 http.port: 9600-9700
然后我们需要设置logstash对日志信息输入输出的配置文件,默认没有,需要复制模板进行配置:
    ##复制模板
[root@localhost ~]# cp /etc/logstash/logstash-sample.conf /etc/logstash/conf.d/logstash.conf

    ##修改配置文件
[root@localhost ~]# vim /etc/logstash/conf.d/logstash.conf
# Sample Logstash configuration for creating a simple
# Beats -> Logstash -> Elasticsearch pipeline.

input {
  beats {
    port => 5044
  }
}

output {
  elasticsearch {
    hosts => ["http://localhost:9200"]
    index => "%{[@metadata][beat]}-%{[@metadata][version]}-%{+YYYY.MM.dd}"
    ##下面的user和password需要打开注释,我们有x-pack认证,需要用户及密码,否则无法连接
    user => "elastic"
    password => "elastic"
  }
}
filebeat:
[root@localhost ~]# vim /etc/filebeat/filebeat.yml

    ##添加注释,禁用,我们不直接输出到elasticsearch
176 #output.elasticsearch:
178   #hosts: ["localhost:9200"]

    ##这里我们要设置输出到logstash,本地可以是localhost,异地则设置为IP地址
189 output.logstash:
191   hosts: ["192.168.85.10:5044"]
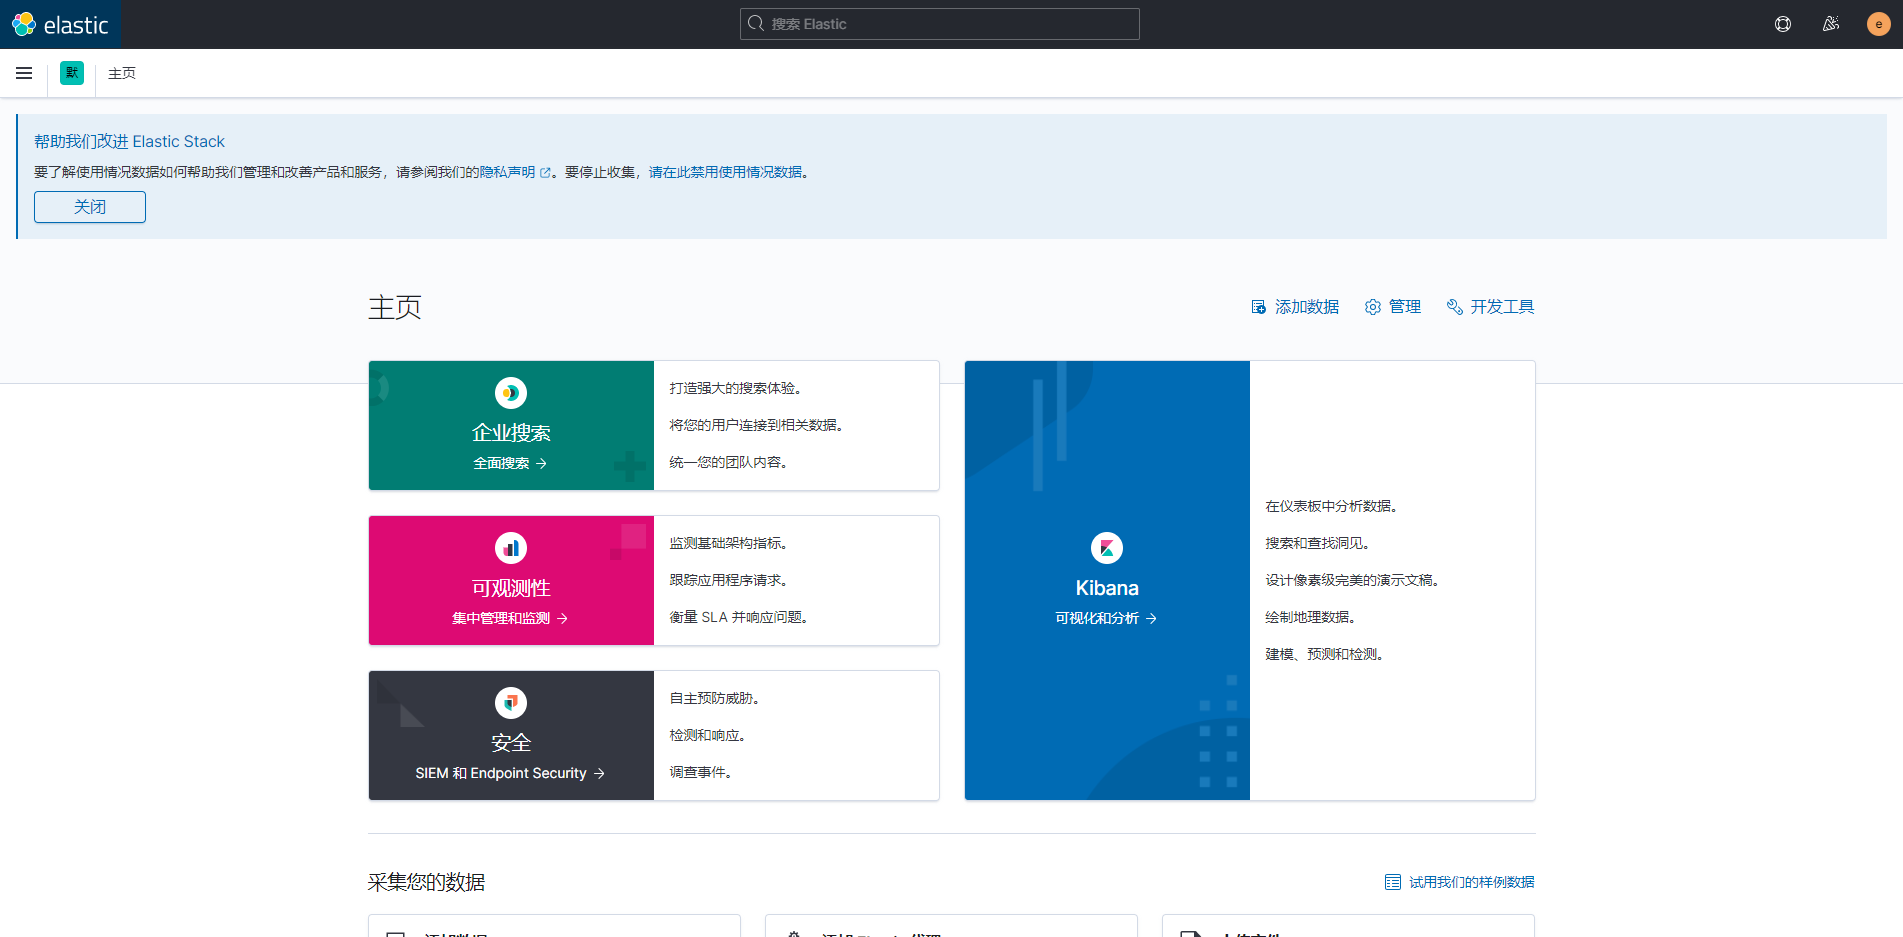
到这我们可以从浏览器去访问Kibana的可视化界面了:
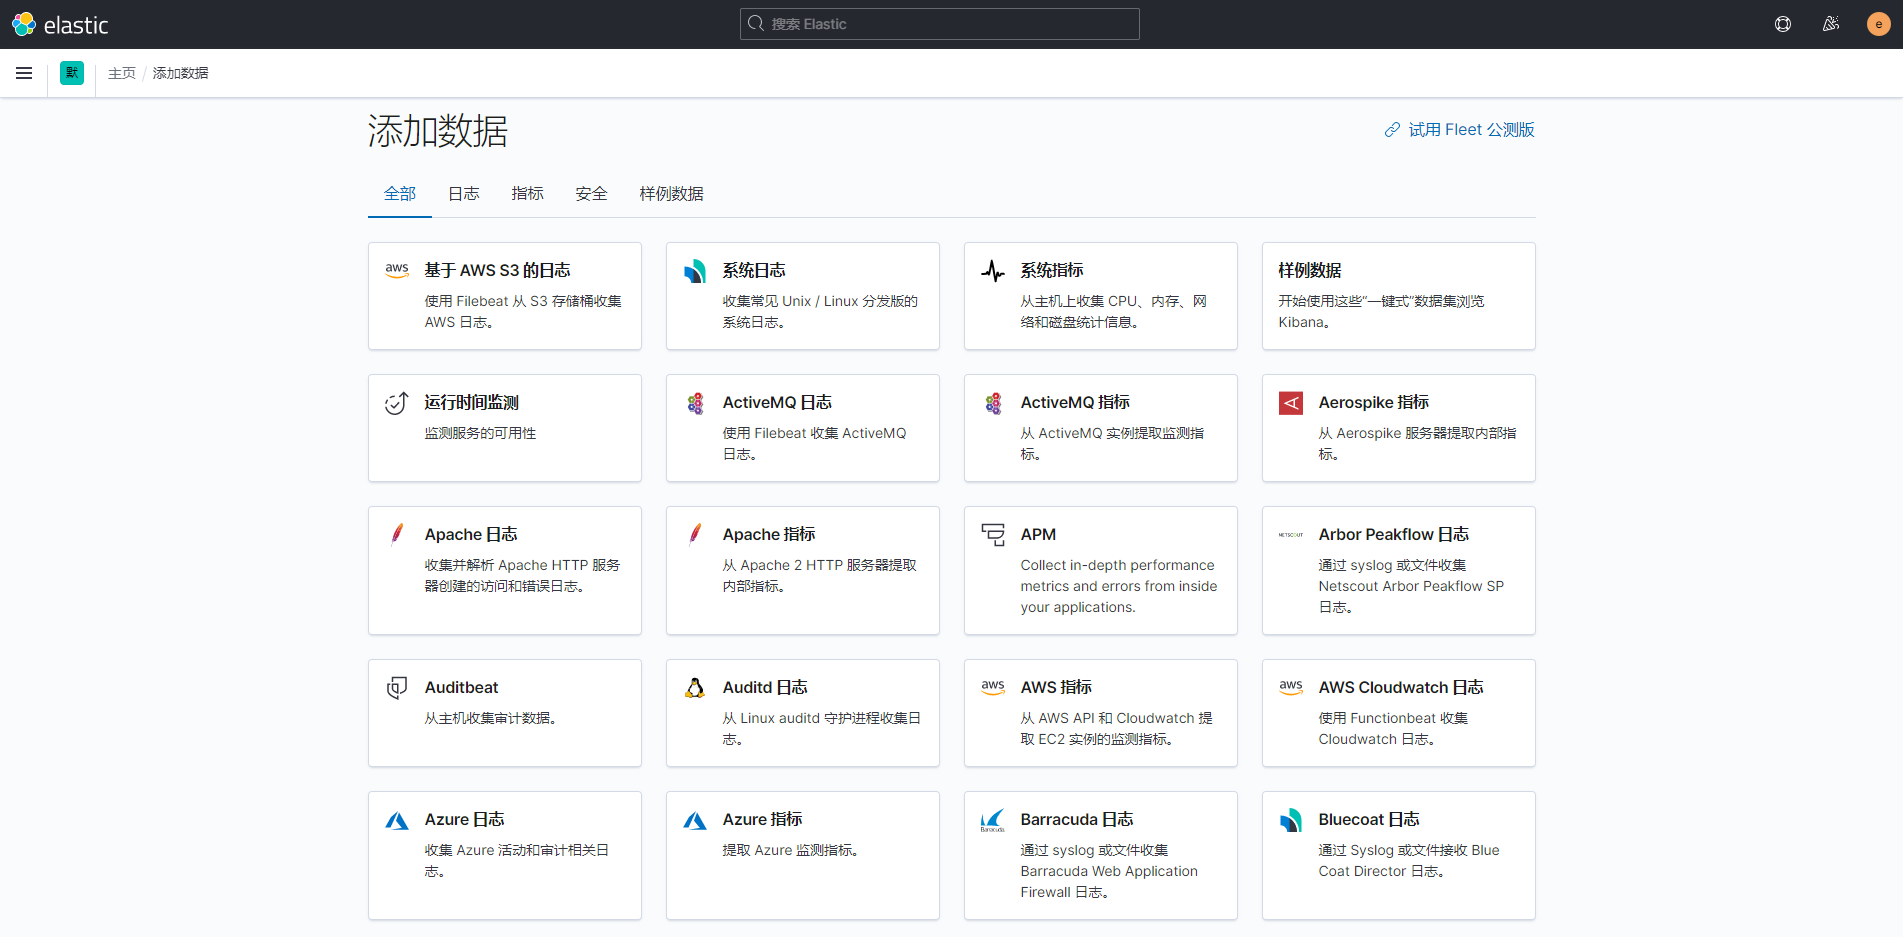
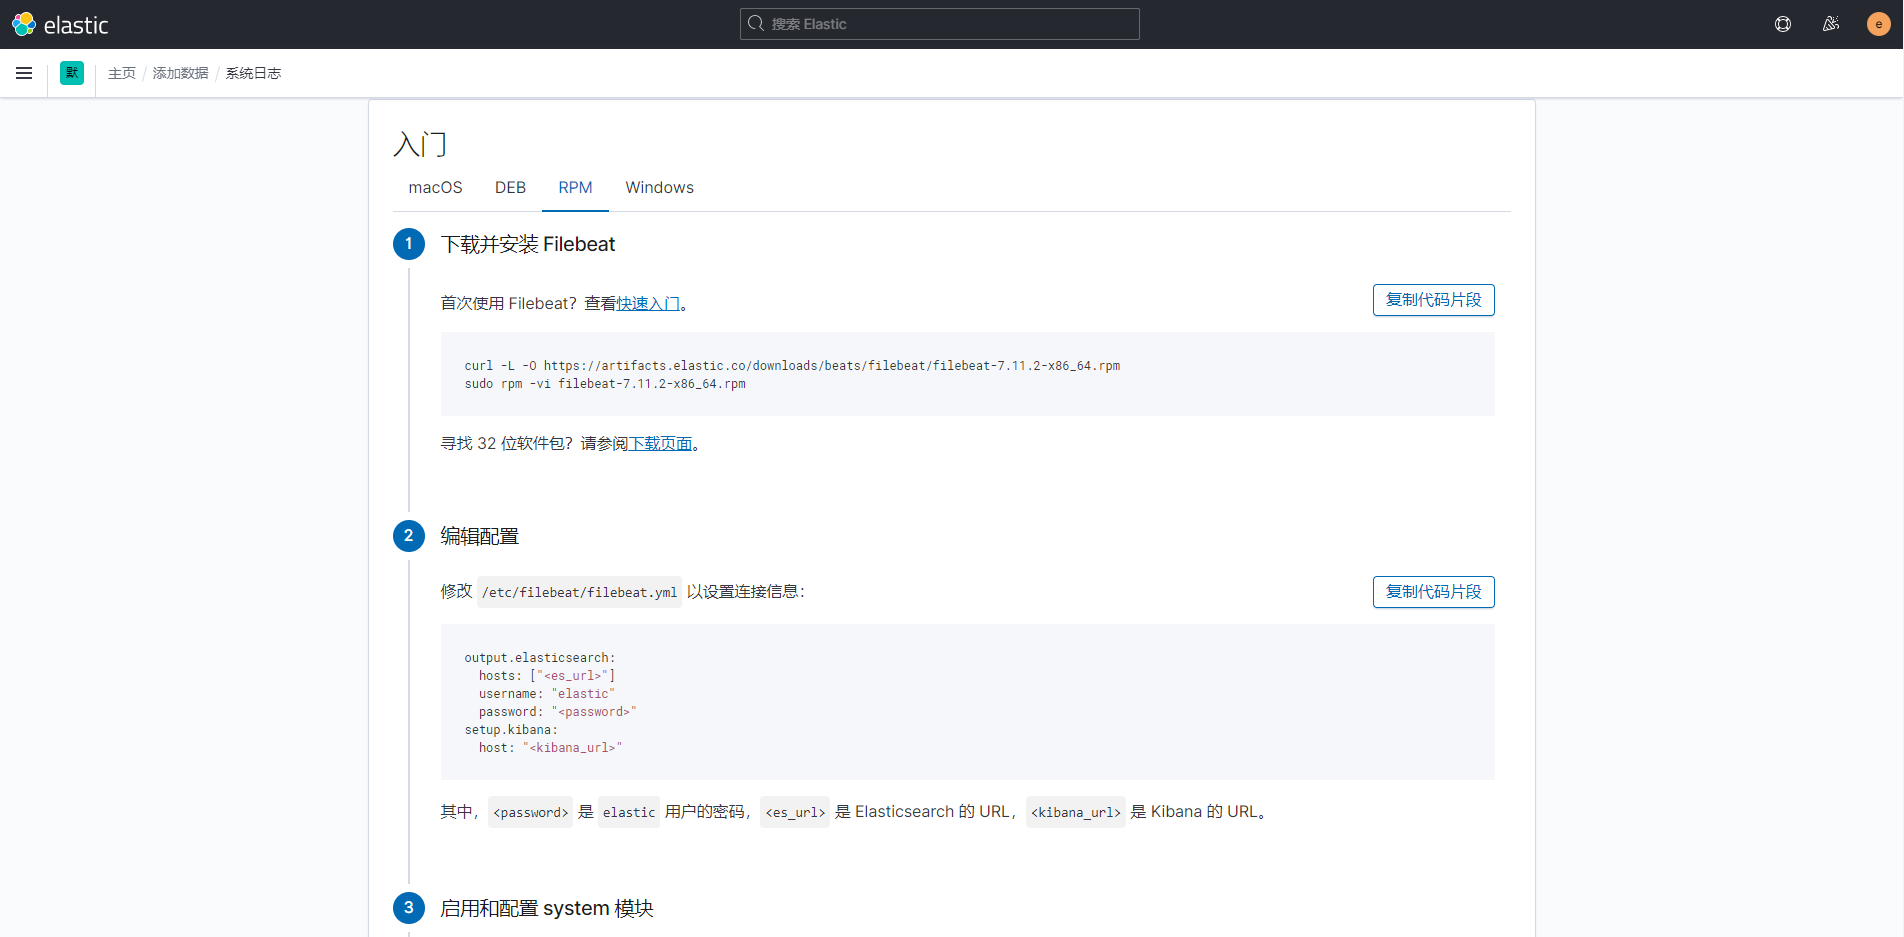
之后我们点击偏右上方的添加数据,进行对filebeat模块设置并采集到日志数据;
可采集的数据类型很丰富,基本常用的都可以找到;
这里提醒一下,我使用的结构这一步是跳过的,上面安装和配置文件结束之后,可以直接跳到 不使用logstash,而是设置filebeat来为多个日志分别设置索引 继续进行设置;
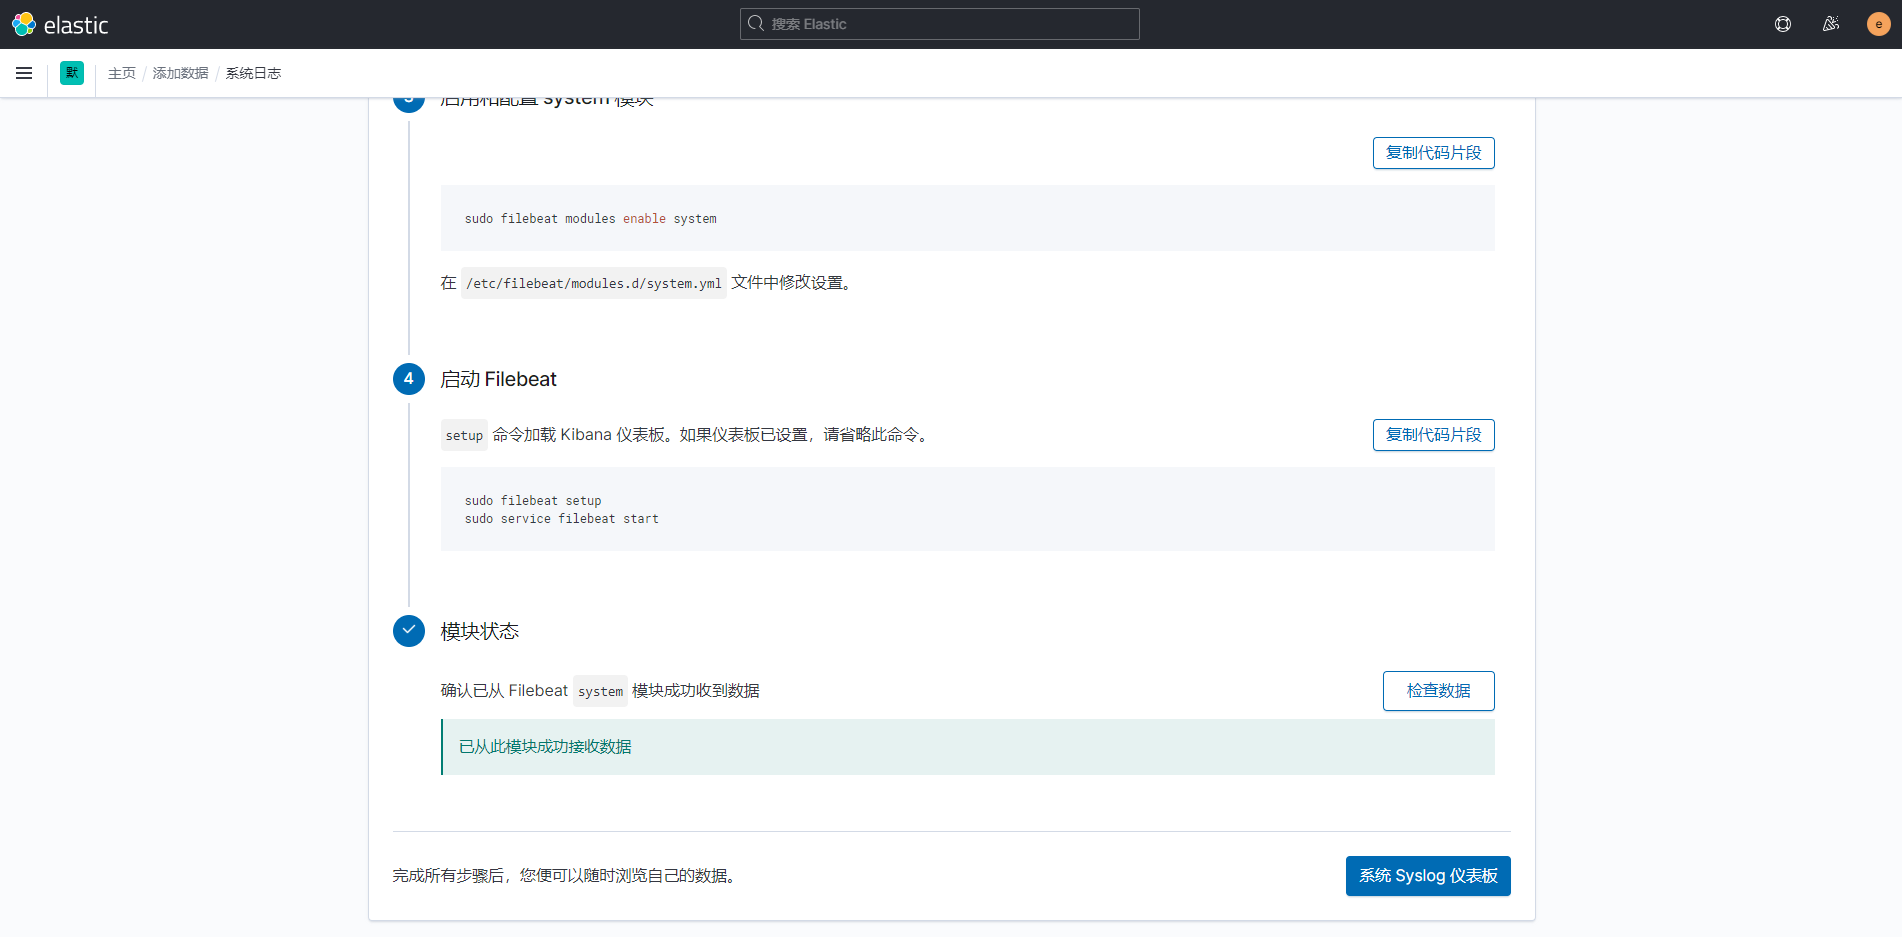
官方的提示是直接将filebeat连接到elasticsearch,而目前我们操作流程是filebeat连接到logstash,但是我们可以关闭logstash,去直接连接elasticsearch,配置文件的设置没有什么区别,开启
不同的模块配置即可;
    ##enable为开启,disable为关闭,多个模块空格分隔,例如:system nginx apache ...
[root@localhost ~]# filebeat modules enable system
Enabled system

    ##启用设置,使之生效
[root@localhost ~]# filebeat setup
Exiting: Index management requested but the Elasticsearch output is not configured/enabled

    ##启动服务,当然,systemctl restart 也可以
[root@localhost ~]# service filebeat start
Starting filebeat (via systemctl):                         [  OK  ]
相对的,这里发现一个问题,虽然这个方式很方便、简单,但是我这边有一个需求,就是我要获取到本机的nginx下的3个虚拟主机的不同的日志,获取的时候
会发现,所有的日志没有办法分类,统一都是nginx.access和nginx.error,数据均在filebeat-7.11.2-日期 这个索引里,不能直接按照不同虚拟主机的日志机型分
类。所以,我仅用这个方法测试了一下数据的获取情况,就停掉了,之后我采用了之后的两种方式,就是手动对各个日志进行索引的分类。
这里再提一下,使用这个方法,可以在Overview --> 日志下以流式传输的方式查看,并由相应的event.dataset来帮你分辨日志来源。
下面两种方法不行,但是可以自己去设定每个日志去建立哪个索引,分类更精准,每个日志文件都可以生成一个属于自己的索引。
配置logstash为多个日志来源分别设置索引
这个方法是我在被迫直接使用 filebeat 之后(这个方法在下一部分),回家找了一些网上的帖子得到的方法,原理基本是同直接设定 filebeat 的方式一样,只不过它是通过 logstash 对加了标识的日志信息做索引分类;
首先我们修改 filebeat 的配置文件:
(这里我收集了nginx的access和error以及系统的日志syslog)
    ##下列没有涉及到的部分配置文件不做修改,下面是要进行修改的配置
[root@postgreSQL ~]# vim /etc/filebeat/filebeat.yml

filebeat.inputs:
    ##类型,默认的log即可
- type: log
    ##默认是false,不启用设置,这里设置好的一定要改成true,否则不生效
  enabled: true
    ##日志路径,绝对路径,可以使用*来做通配,但是我并没有这么做,日志索引的信息我是定期删除的,这个也要考虑一下你的日志滚动设置
  paths:
    - /var/log/messages
    ##这个是为我们采集的每条日志信息增加一个标签一样的东西,来进行标识,为啥是这个,我不知道,反正大家都这么写的,哈哈
  fields:
    index: syslog-91

- type: log
  enabled: true
  paths:
    - /var/log/nginx/access.log
  fields:
    index: nginx-access

- type: log
  enabled: true
  paths:
    - /var/log/nginx/error.log
  fields:
    index: nginx-error

# ---------------------------- Elasticsearch Output ----------------------------
    ##这个是默认开启的,我们要把采集的日志送到logstash中,所以要关闭这个,当前配置只允许开启一个output设置,不能双开
#output.elasticsearch:
    ##这个也注释上
  #hosts: ["localhost:9200"]

# ------------------------------ Logstash Output -------------------------------
    ##默认关闭的,我们使用logstash进行配置,所以去掉注释打开
output.logstash:
    ##地址要填写logstash得到主机IP地址,端口号默认是5044,但其实它是在logstash主机下的 /etc/logstash/conf.d/logstash.conf 中设置的
  hosts: ["192.168.85.10:5044"]
之后我们对logstash进行配置:
主配置文件 /etc/logstash/logstash.yml 我们在安装的时候已经进行配置了,这里不需要修改;
/etc/logstash/conf.d/logstash.conf 的配置文件我们安装的时候 cp 复制了一份,这里需要修改:
# Sample Logstash configuration for creating a simple
# Beats -> Logstash -> Elasticsearch pipeline.

input {
  beats {
    port => 5044
  }
}

output {
  elasticsearch {
    hosts => ["http://localhost:9200"]
    ##格式这里,[fields] 和 [index] 分别对应 filebeat 中对日志文件设置的“标签”
    index => "%{[fields][index]}-%{[@metadata][beat]}-%{+YYYY.MM.dd}"
    user => "elastic"
    password => "elastic"
  }
}
之后我们分别在相应的主机上重启 logstash 和 filebeat:
    ##logstash端重启服务
[root@localhost kibana]# systemctl restart logstash

    ##filebeat端,记得开启nginx,并做几次成功和失败的访问,然后去看看日志刷新情况
[root@postgreSQL ~]# systemctl status filebeat
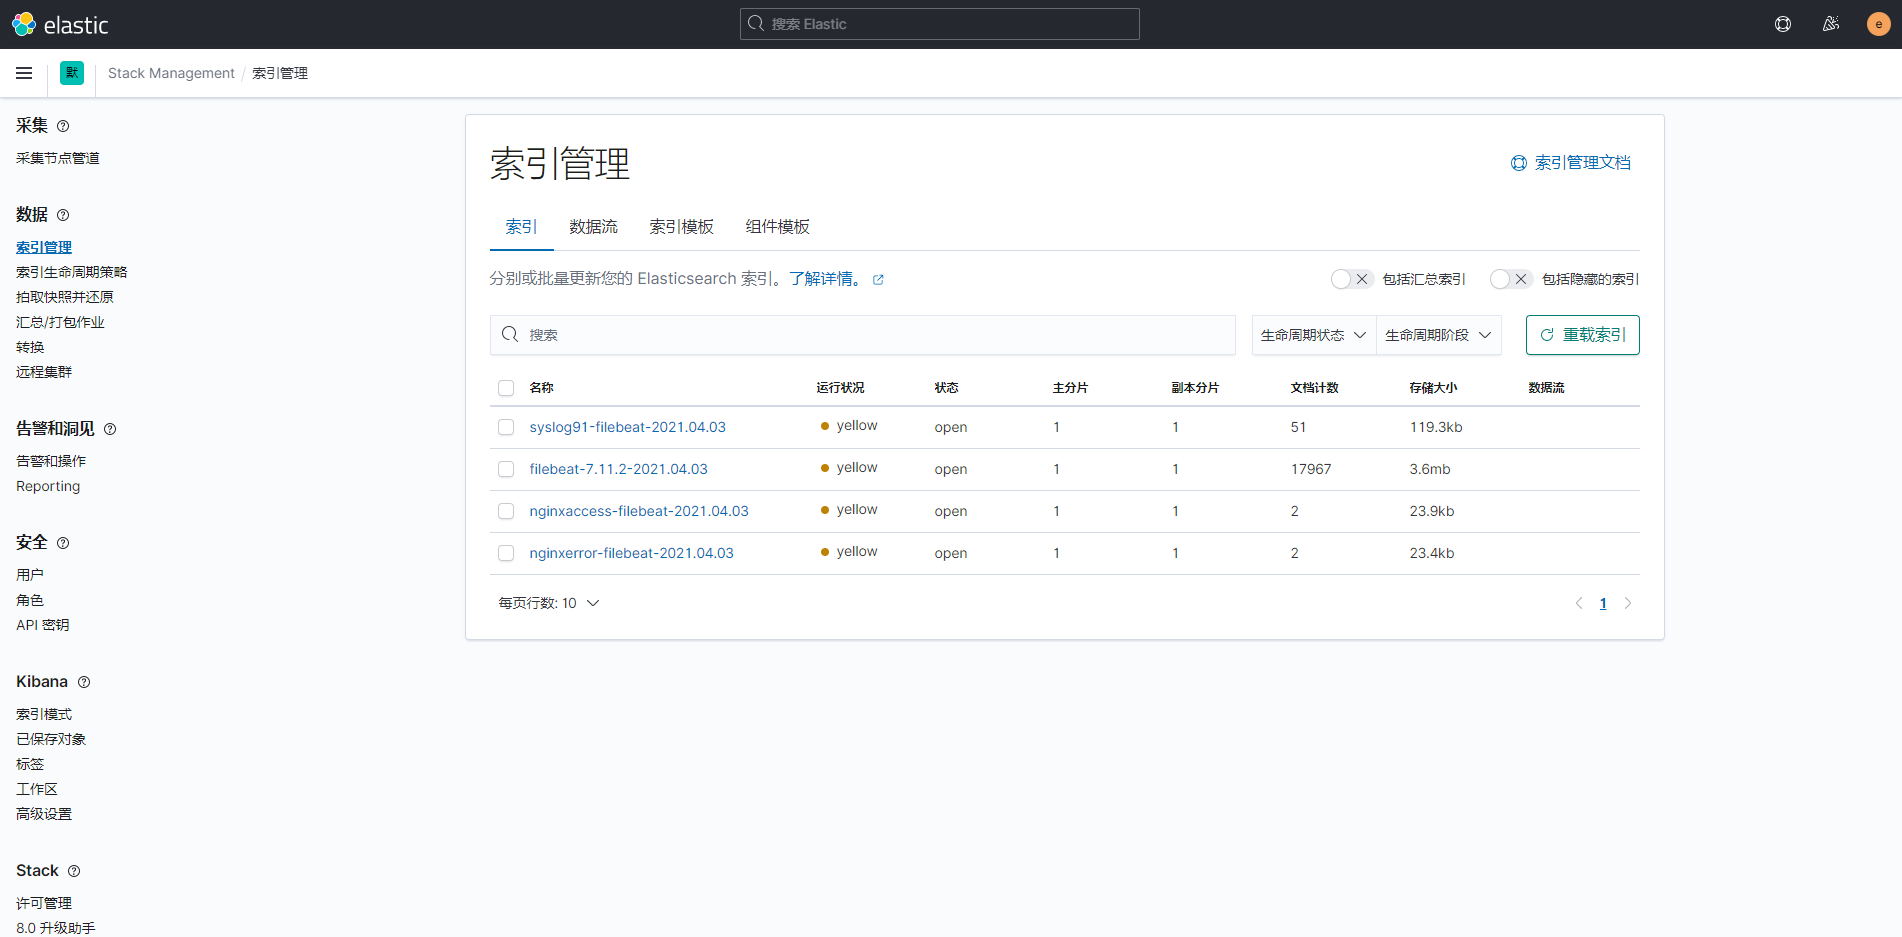
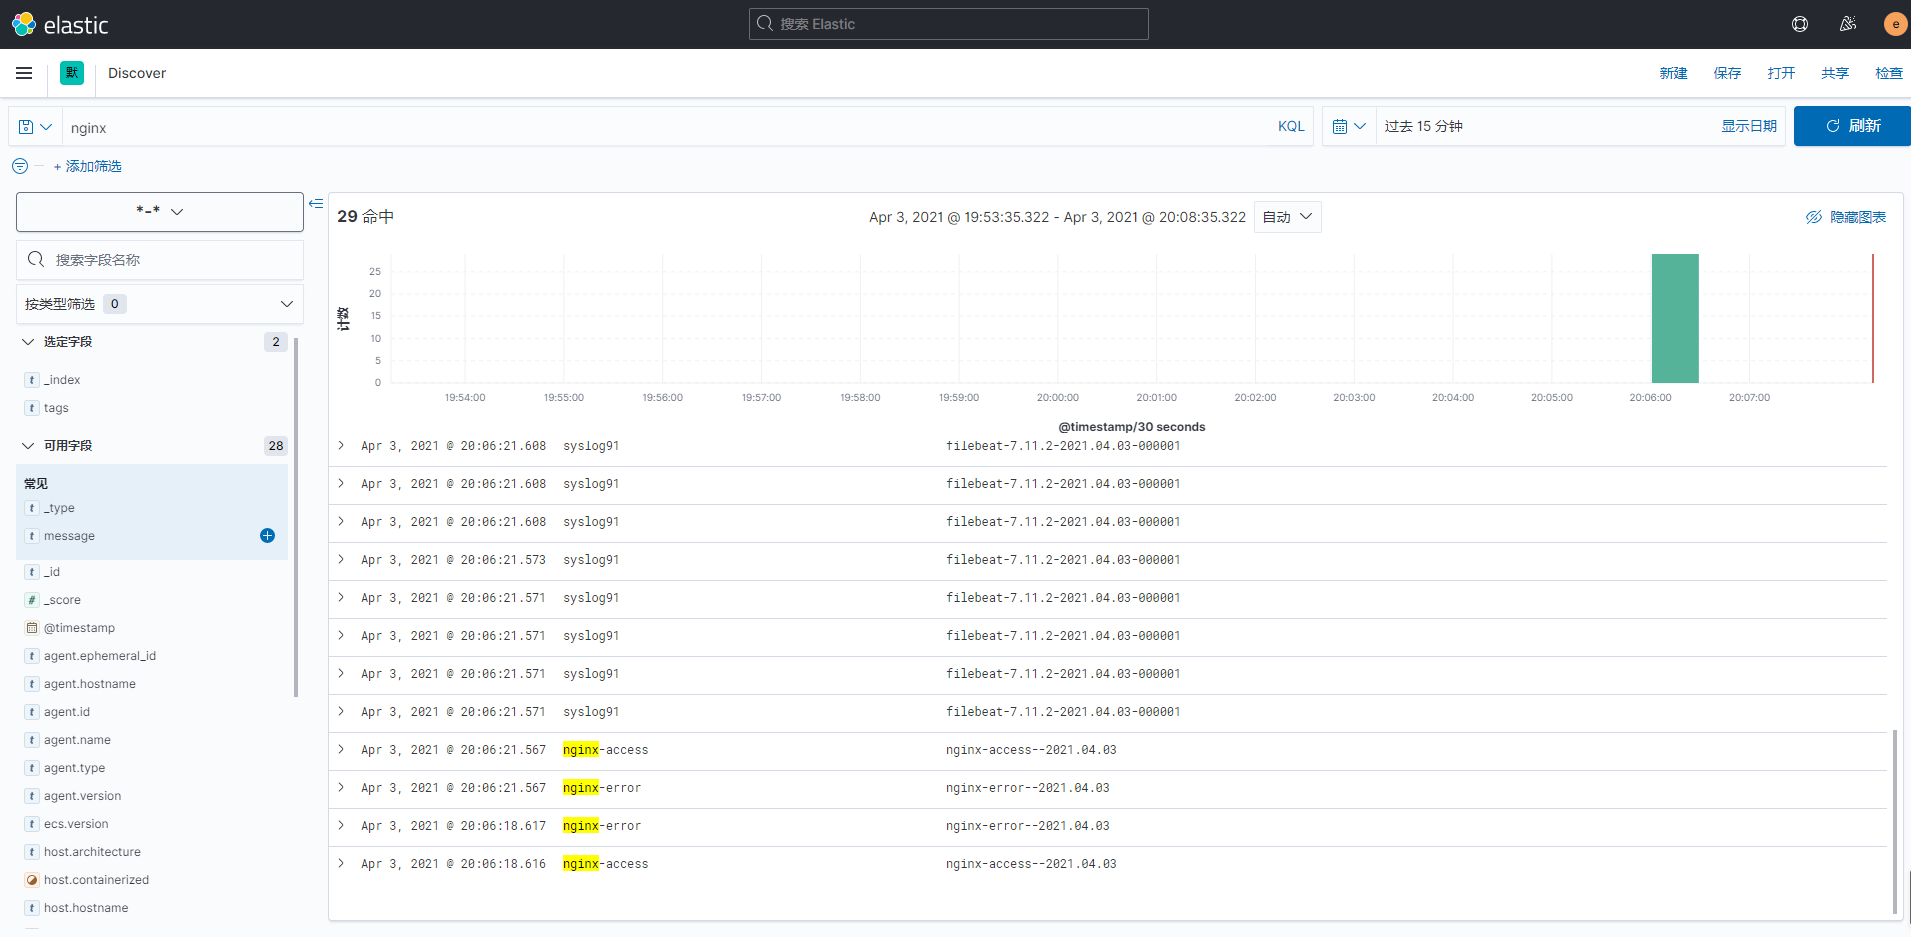
然后去kibana的索引管理以及 Analytics --> Discover 中查看日志数据:
(查看日志数据需要先创建一个匹配的索引模式,我直接创建一个根据 *-* 匹配的模式,因为命名中由 - 来连接字符)
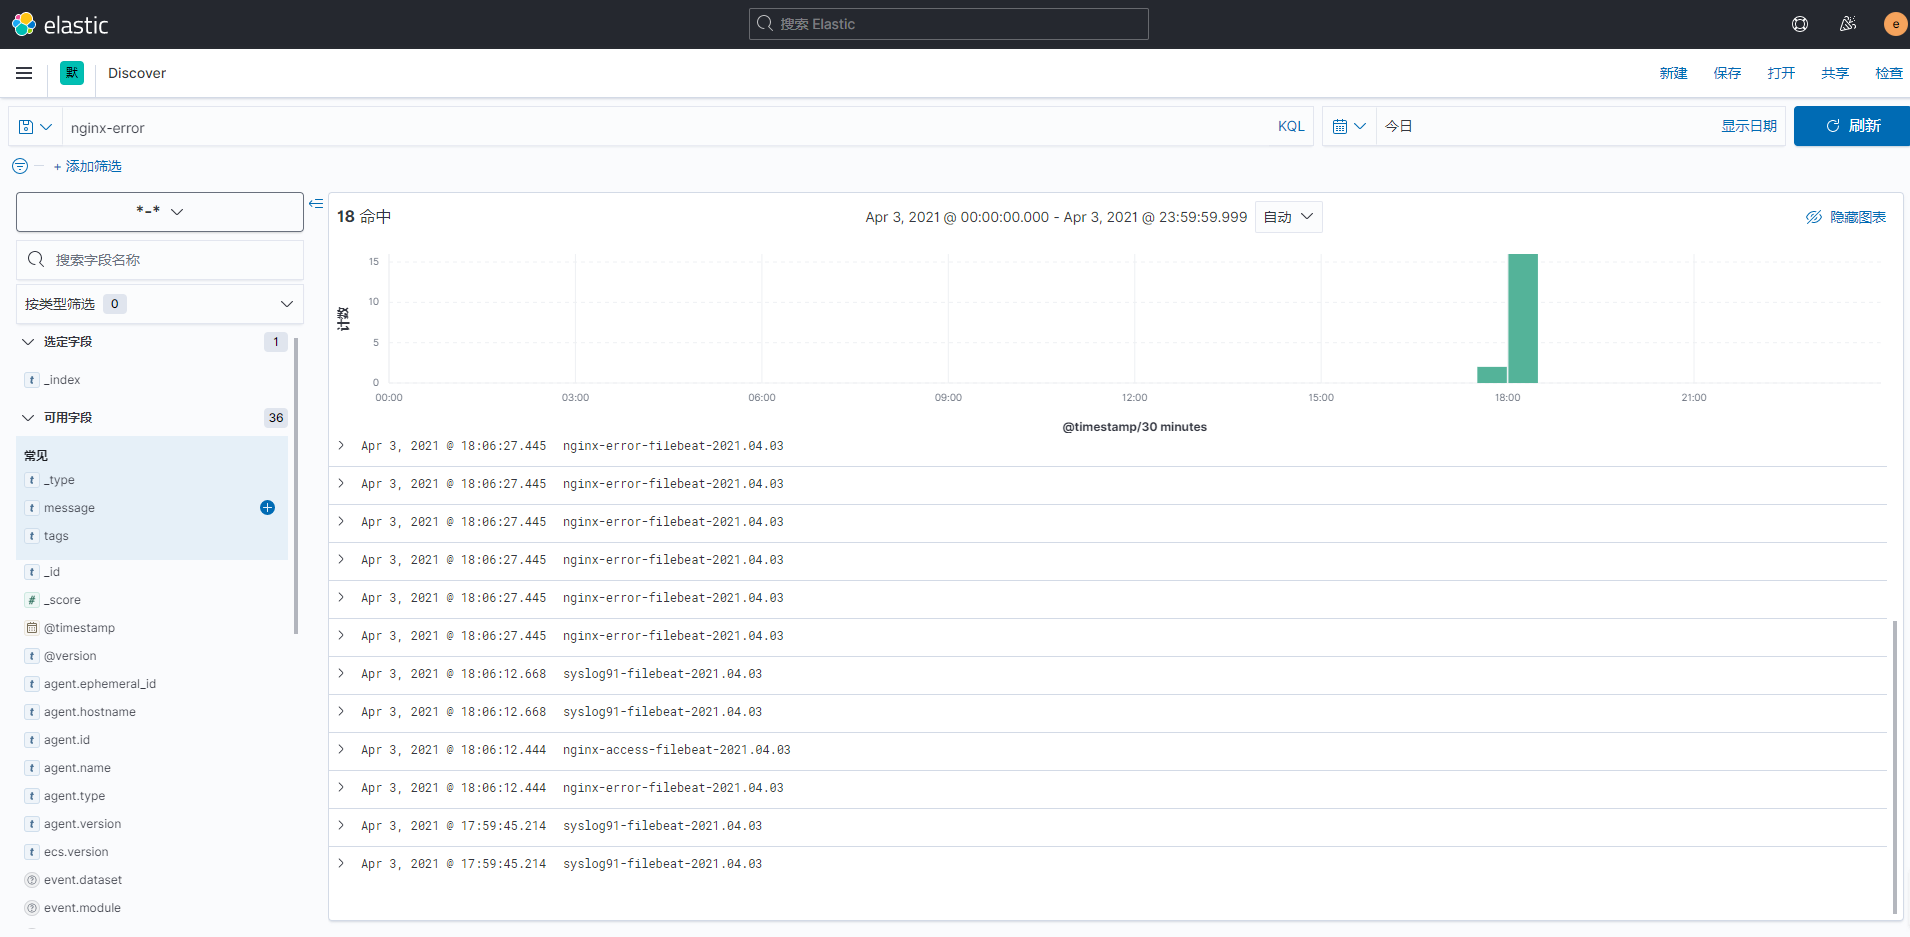
可以添加指定的字段,有选择的显示内容并进行搜索:
不使用logstash,而是设置filebeat来为多个日志分别设置索引
这个方法其实最初是因为我配置不明白logstash来分索引,而用的一种替代方案,但是后来又发现我安装ELK的服务器只有8G的内存,配置低;所以理所应当的也就把logstash停止了(也就开个nginx,之后加上 Elasticsearch 和 kibana 还有 filebeat 这3个,内存已经是平稳使用75%-80%了);
该方案只是替代方案,而且没有Logstash来为你做日志信息的格式化输出,除了结构简单,顺便能稍微省点资源;且由于日常的日志量不大,也不怕丢失,我暂时使用的就是 Elasticsearch + Kibana + filebeat 这个方案;
首先我们调整 filebeat 的配置文件:
(使用上一种方法的配置文件进行修改,顺便可以比对一下具体是哪里发生了变化)
[root@postgreSQL ~]# vim /etc/filebeat/filebeat.yml

filebeat.inputs:
- type: log
  enabled: true
  paths:
    - /var/log/messages
    ##将fields 和 index 去掉了,使用一个 tags 的标签来标识日志文件来源
  tags: ["syslog91"]

- type: log
  enabled: true
  paths:
    - /var/log/nginx/access.log
  tags: ["nginx-access"]

- type: log
  enabled: true
  paths:
    - /var/log/nginx/error.log
  tags: ["nginx-error"]

# ---------------------------- Elasticsearch Output ----------------------------
output.elasticsearch:
  # Array of hosts to connect to.
    ##这里我们要设置连接的elasticsearch的IP地址,当然,相应的我们也需要修改elasticsearch中的配置,下面会有
  hosts: ["192.168.85.10:9200"]
  indices:
    ##索引名称
  - index: "syslog2--%{+YYYY.MM.dd}"
    ##匹配包含字段
    when.contains:
    ##去匹配包含syslog2内容的信息
      tags: "syslog2"
  - index: "nginx-access--%{+YYYY.MM.dd}"
    when.contains:
      tags: "nginx-access"
  - index: "nginx-error--%{+YYYY.MM.dd}"
    when.contains:
      tags: "nginx-error"
    ##由于x-pack设置,我们需要添加连接到elasticsearch的认证用户及密码
  username: "elastic"
  password: "elastic"

    ##填加kibana的认证用户及密码
# =================================== Kibana ===================================

# Starting with Beats version 6.0.0, the dashboards are loaded via the Kibana API.
# This requires a Kibana endpoint configuration.
setup.kibana:
  username: "kibana_system"
  password: "kibana_system"

    ##关闭输出到logstash
# ------------------------------ Logstash Output -------------------------------
#output.logstash:
  # The Logstash hosts
  # hosts: ["192.168.85.10:5044"]
之后我们修改elasticsearch和kibana的配置文件:
[root@localhost ~]# vim /etc/elasticsearch/elasticsearch.yml

    ##将本地绑定的127.0.0.1改为主机的IP地址,使其他主机上的filebeat服务访问到elasticsearch
 55 network.host: 192.168.85.10

[root@localhost ~]# vim /etc/kibana/kibana.yml

    ##kibana配置文件也需要修改,否则连接不到elasticsearch
 32 elasticsearch.hosts: ["http://192.168.85.10:9200"]
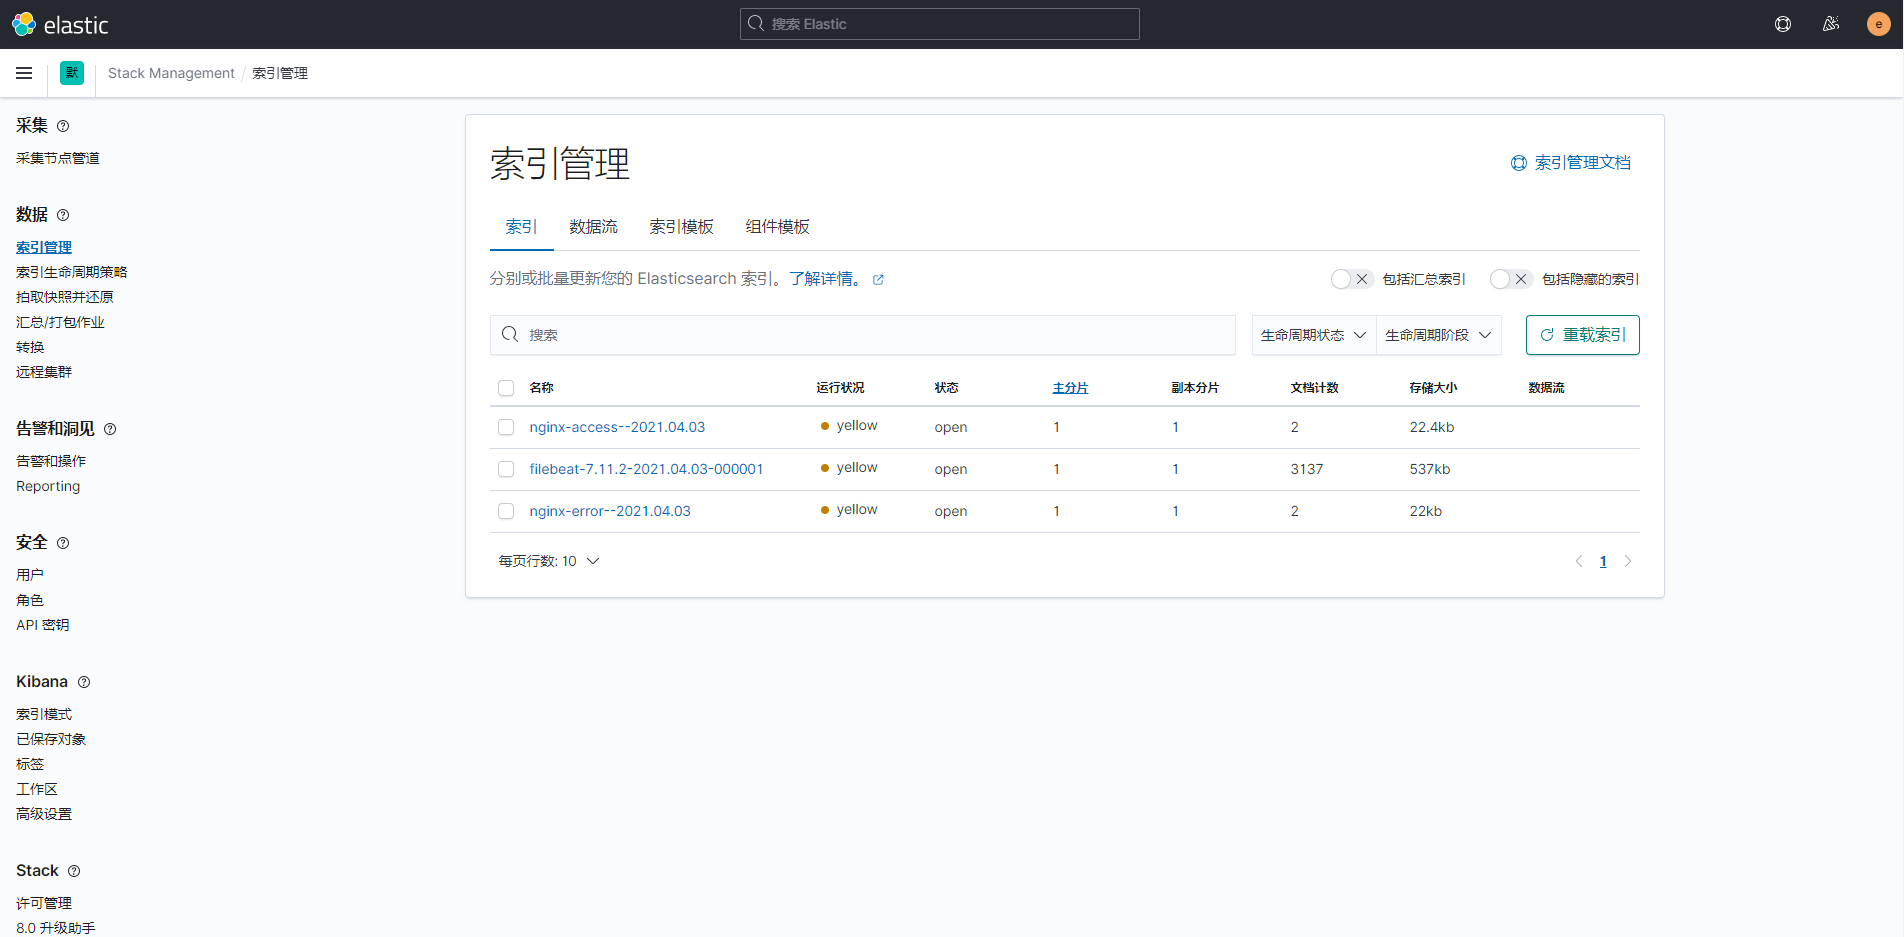
然后我们重启服务,去访问看看是否生效:
    ##重启elasticsearch服务,顺便把logstash停了
[root@localhost ~]# systemctl stop logstash
[root@localhost ~]# systemctl restart elasticsearch

    ##采集日志的主机重启filebeat服务
[root@postgreSQL ~]# systemctl restart filebeat
ElastAlert安装
官方文档:https://elastalert.readthedocs.io/en/latest/running_elastalert.html#downloading-and-configuring
https://elastalert.readthedocs.io/en/latest/recipes/writing_filters.html#writingfilters
(要了解学习更多,就要常看官方文档,非常详细;当然,你可能需要翻译,它是英文的)
这里特殊说明一下,当前文档写作是2021年4月,当前版本的elastalert只可以用python3.6,官方的github的页面也已经做了说明;
为什么说用python3.6呢,因为我当时没看文档,用自带的python(CentOS7自带2.7.5)和自己安装的python3.7都不行,同一步骤
各种报错,不是缺少插件就是语法错误,起初我还认为是真的语法错误,但是这软件这么多人用也没说有问题,那么问题一定是我
的问题,哈哈;
报错如果说你没有某个模块,你下载安装相应的模块即可,但是要记住你安装是用pip3(我们会yum安装python36),而不是pip,默认的pip是pip2;
报错如果说你语法错误,那并不是语法错误,而是因为python版本的问题,执行时有python的,替换为python3即可;
若使用pip报错,那么使用pip3看看,使用pip3报错那么试试pip2,常用 pip list 和 pip3 list 看看自己已经是否安装了相应的插件,自己一定不要乱套;
解决环境依赖问题:
    ##解决python3和其他一些依赖关系,当然,下面还需要git,若没有可以添加git一起安装
[root@localhost ~]# yum install -y epel-release
[root@localhost ~]# yum install -y python36 python-dev libsasl2-devel libffi-dev libffi-devel libssl-dev python36-devel libevent-devel gcc gcc-c++
下载ElastAlert及dingtalk插件:
    ##git下载需要带有git命令,yum可以进行安装,或者在windows主机下载压缩包拿过来,unzip解压即可
[root@localhost ~]# git clone https://github.com/Yelp/elastalert.git
[root@localhost ~]# wget https://github.com/xuyaoqiang/elastalert-dingtalk-plugin/archive/master.zip
[root@localhost ~]# unzip elastalert-dingtalk-plugin-master
    ##名字太长了,我们改一下吧
[root@localhost ~]# mv elastalert-dingtalk-plugin-master dingtalk

    ##得到两个目录,位置可以自己定,我目前测试是直接给他放root下了
[root@localhost ~]# ls -ld elastalert elastalert-dingtalk-plugin-master
drwxr-xr-x 10 root root 4096 Apr  6 21:54 elastalert
drwxr-xr-x  4 root root  123 Apr  8 07:10 dingtalk
安装ElastAlert和dingtalk插件:
[root@localhost ~]# cd /elastalert/
    ##安装模块
[root@localhost elastalert]# pip3 install setuptools==44.0.0
[root@localhost elastalert]# python setup.py install
    ##我们还需要一个elasticsearch-py,我们是7.11.2,但是后面创建索引的时候会提示你需要7.0.0,要不不能创建,所以这里我们安装7.0.0
[root@localhost elastalert]# pip3 install elasticsearch==7.0.0

    ##切换到dingtalk目录下
[root@localhost elastalert]# cd ../dingtalk
    ##这个安装会大量下包,不要终止它
[root@localhost ~]# pip install -r requirements.txt

    ##然后我们需要把dingtalk的模块文件复制到elastalert目录下,否则之后我们配置的时候它会报错找不到模块
[root@localhost elastalert]# cp -r ../dingtalk/elastalert_modules .
检查安装情况:
   ##安装成功后会出现4个命令,下面的目录及其子文件可以忽略
[root@localhost elastalert]# ls -l /usr/bin/elastalert*
-rwxr-xr-x 1 root root 316 Apr  6 21:55 /usr/bin/elastalert
-rwxr-xr-x 1 root root 342 Apr  6 21:55 /usr/bin/elastalert-create-index
-rwxr-xr-x 1 root root 350 Apr  6 21:55 /usr/bin/elastalert-rule-from-kibana
-rwxr-xr-x 1 root root 336 Apr  6 21:55 /usr/bin/elastalert-test-rule

/usr/bin/elastalert.egg-info:
total 24
-rw-r--r-- 1 root root   1 Apr  6 21:55 dependency_links.txt
-rw-r--r-- 1 root root 226 Apr  6 21:55 entry_points.txt
-rw-r--r-- 1 root root 417 Apr  6 21:55 PKG-INFO
-rw-r--r-- 1 root root 369 Apr  6 21:55 requires.txt
-rw-r--r-- 1 root root 205 Apr  6 21:55 SOURCES.txt
-rw-r--r-- 1 root root   1 Apr  6 21:55 top_level.txt
配置ElastAlert主配置文件:
    ##dingtalk插件的目录下有安装文件和一些参考和说明文件,在编写规则时可以进行参考,但是我们能进行编写即可,一般不用
[root@localhost ~]# cd dingtalk/
[root@localhost dingtalk]# ll
total 12
-rw-r--r-- 1 root root 1762 Sep 15  2017 config.yaml
drwxr-xr-x 2 root root   50 Sep 15  2017 elastalert_modules
-rw-r--r-- 1 root root  688 Sep 15  2017 README.md
-rw-r--r-- 1 root root   92 Sep 15  2017 requirements.txt
drwxr-xr-x 2 root root   57 Sep 15  2017 rules

    ##ElastAlert目录下原本只有主配置文件模板,我们要复制创建一个主配置文件
[root@localhost ~]# cd elastalert
[root@localhost elastalert]# cp config.yaml.example config.yaml

    ##之后我们进行主配置文件的调整
[root@localhost elastalert]# vim config.yaml

    ##这个是我们配置的规则文件的目录,相对路径即可,这里我没有变动,一会规则文件都塞到这里面
  3 rules_folder: example_rules

    ##
  7 run_every:
  8   minutes: 1

    ##
 12 buffer_time:
 13   minutes: 15

    ##我们elasticsearch的地址,我这里设定的是IP
 17 es_host: 192.168.85.10

    ##端接我这里没有变化,若自行设定请修改正确
 20 es_port: 9200

    ##这里是elasticsearhc的认证用户及密码,若设定了就需要填写,没有则可以#注释,不使用
 46 es_username: elastic
 47 es_password: elastic

    ##这个是我们为ElastAlert创建的索引,默认即可,一会后面我们会进行创建,若自定义请填写正确
 59 writeback_index: elastalert_status
 60 writeback_alias: elastalert_alerts

    ##
 64 alert_time_limit:
 65   days: 2
在Elasticsearch创建索引:
    ##这里提醒一下,一般情况下创建 elastalert-create-index --index elastalert_status 和 elastalert-create-index 两个命令都是可以的
    ##若一个不行可以用另一个试一试,我在删除索引之后重建使用 elastalert-create-index 不能创建,后面必须加 --index elastalert_status 才可以执行成功
    ##创建成功后,在Kibana中就可以看到该条索引了
[root@localhost elastalert]# elastalert-create-index --index elastalert_status
Elastic Version: 7.11.2
Reading Elastic 6 index mappings:
Reading index mapping ‘es_mappings/6/silence.json‘
Reading index mapping ‘es_mappings/6/elastalert_status.json‘
Reading index mapping ‘es_mappings/6/elastalert.json‘
Reading index mapping ‘es_mappings/6/past_elastalert.json‘
Reading index mapping ‘es_mappings/6/elastalert_error.json‘
New index elastalert_status created
Done!
到这里安装基本完成,可以使用,接下来比较重要,编写并调试规则配置,这个是发送报警的重点;
ElastAlert规则配置文件编写及调试说明
规则配置文件这里单独拿出来做一个部分,因为这个需要经常进行创建、调整配置(我个人在这个地方卡了将近一个星期,当时我由于各种原因极其烦躁,静不下来);
编写报警规则:
    ##到我们的规则文件目录里来
[root@localhost example_rules]# pwd
/root/elastalert/example_rules
    ##我们需要编辑一个规则文件,可以从现有的模板进行一次复制
[root@localhost example_rules]# cp example_frequency.yaml syslog10.yaml

    ##编辑规则文件
[root@localhost example_rules]# vim syslog200.yaml
# Alert when the rate of events exceeds a threshold

# (Optional)
# Elasticsearch host
    ##这里是elasticsearch的地址
es_host: 192.168.85.10

# (Optional)
# Elasticsearch port
    ##这里是elasticsearch的端口
es_port: 9200

# (OptionaL) Connect with SSL to Elasticsearch
    ##这里是设置开启ssl,注释掉,我们没有开启
#use_ssl: True

# (Optional) basic-auth username and password for Elasticsearch
    ##elasticsearch的认证账户密码,正确填写
es_username: elastic
es_password: elastic

# (Required)
# Rule name, must be unique
    ##这里是我们发送的消息的标题
name: 发送消息

# (Required)
# Type of alert.
# the frequency rule type alerts when num_events events occur with timeframe time
    ##这里是规则类型,frequency是根据我们设定的频率匹配,后面设定;
    ##详细参考:https://elastalert.readthedocs.io/en/latest/ruletypes.html#ruletypes
type: frequency

# (Required)
# Index to search, wildcard supported
    ##这里是我们要匹配的索引,可以用 * 来匹配
index: nginx*

# (Required, frequency specific)
# Alert when this many documents matching the query occur within a timeframe
    ##这里设置在我们规定的时间内出现了多少频次可匹配到的规则就需要进行报警
num_events: 1

# (Required, frequency specific)
# num_events must occur within this amount of time to trigger an alert
    ##这里接上面,规定的时间,单位有hours、minutes、seconds(时、分、秒)
timeframe:
  minutes: 1

# (Required)
# A list of Elasticsearch filters used for find events
# These filters are joined with AND and nested in a filtered query
# For more info: http://www.elasticsearch.org/guide/en/elasticsearch/reference/current/query-dsl.html
    ##这里是我们重点,匹配的规则,翻译为过滤器,我们暂时设定匹配ERROR的message消息来进行测试
    ##详情参考:https://elastalert.readthedocs.io/en/latest/recipes/writing_filters.html#writingfilters
filter:
- query:
    query_string:
      query: "message: ERROR"

# (Required)
# The alert is use when a match is found
    ##这里是加载模块,注意!暂时我们要写这个样子,有的帖子只写dingtalk的,甚至插件的github页面也是这么写,可能仅代表标签,只写dingtalk写会报错
alert:
- "elastalert_modules.dingtalk_alert.DingTalkAlerter"

    ##下面是我们钉钉机器人的地址,和文档类型
dingtalk_webhook: "https://oapi.dingtalk.com/robot/send?access_token=************************************"
dingtalk_msgtype: text

    ##这下面是邮箱发送的一些配置,我们本次不使用邮箱,所以把他注释上
    ##比如我使用163邮箱发送,这个需要开通smtp服务
#smtp_host: smtp.163.com
    ##这个端口是非ssl的,若你开了ssl需要更换,163、qq的都不一样,网上可以查到
#smtp_port: 25
    ##这个是用来发送的邮箱的账号和认证密码存放文件的绝对路径,在
#smtp_auth_file: /root/elastalert/example_rules/testauth.yaml
    ##用来接收邮件的邮箱地址
#email_reply_to: *****@qq.com
    ##用来发送邮件的邮箱地址
#from_addr: *****@163.com

# (required, email specific)
# a list of email addresses to send alerts to
# email:
# - "elastalert@example.com"
邮箱认证文件(用钉钉可以不配置,邮箱需要):
[root@localhost example_rules]# vim testauth.yaml

    ##用来发邮件的邮箱地址
user: ***********@163.com
    ##这个密码是你开通smtp功能后官方给你的密码,是一串字母,可不是你自己设定的邮箱密码
password: sdgkljsklgslvgb
运行进行测试:
这里提醒一下:运行的时候也是会大量报错的,原因可能是你某些模块没有安装,也可能是你的yaml文件格式不对;
还是要仔细看报错信息,打开你的谷歌翻译去翻译一下,里面的信息很重要,很多可以帮你解决问题的命令都在里面;
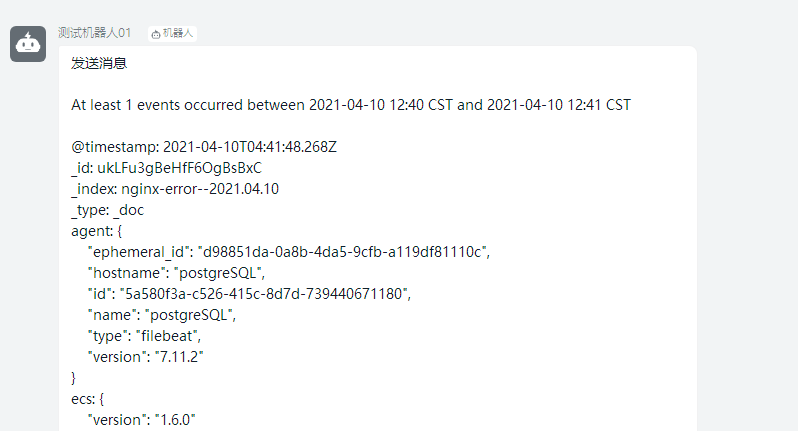
[root@localhost elastalert]# python3 -m elastalert.elastalert --verbose --config ./config.yaml --rule ./example_rules/syslog10.yaml
1 rules loaded
INFO:elastalert:Starting up
INFO:elastalert:Disabled rules are: []
INFO:elastalert:Sleeping for 59.999936 seconds
INFO:elastalert:Queried rule 发送消息 from 2021-04-10 12:38 CST to 2021-04-10 12:41 CST: 0 / 0 hits
INFO:elastalert:Ran 发送消息 from 2021-04-10 12:38 CST to 2021-04-10 12:41 CST: 0 query hits (0 already seen), 0 matches, 0 alerts sent
INFO:elastalert:Background configuration change check run at 2021-04-10 12:42 CST
INFO:elastalert:Disabled rules are: []
INFO:elastalert:Sleeping for 59.999764 seconds
INFO:elastalert:Background alerts thread 0 pending alerts sent at 2021-04-10 12:42 CST
INFO:elastalert:Queried rule 发送消息 from 2021-04-10 12:38 CST to 2021-04-10 12:42 CST: 72 / 72 hits
INFO:elastalert:Ignoring match for silenced rule 发送消息
INFO:elastalert:Ignoring match for silenced rule 发送消息
INFO:elastalert:Ignoring match for silenced rule 发送消息
INFO:elastalert:Ignoring match for silenced rule 发送消息
    ......
    ......
之后我的钉钉收到了消息,不过比较长,把整个一条的索引信息全部发过来了;
但是这已经证明我们的配置是成功的,之后就是对发送信息的调整了;
生产环境正常运行:
    ##需要使用相对路径,绝对路径会报错,所以要先进入文件目录;
[root@localhost ~]# cd /root/elastalert
    ##将其放入后台
[root@localhost elastalert]# nohup python3 -m elastalert.elastalert --verbose --config ./config.yaml --rule ./example_rules/syslog10.yaml &

    ##如果有很多配置文件,那么把可以用的放到我们配置的规则文件目录下(配置不正确的规则文件会导致报错,要移出规目录),然后就不用指定参数 --rule 了,同理 --config 的参数也不是必须的,但是切到目录下是必须的
[root@localhost elastalert]# nohup python3 -m elastalert.elastalert --verbose
ElastAlert安装及使用中遇到的报错问题
这里总结一些报错信息,供大家参考:
1、安装时的报错:
这个问题一般出现在 python setup.py install 和 pip install -r requirements.txt 的时候,我在安装的时候就有点纳闷,为什么我安装时用python(自带的2.7)来安装,而我运行缺需要用python3来运行;但是
讨论这些大多数情况都是浪费时间,我们的首要目标应该是让它可以正常使用,所以当下只管安装上即可,至于什么原理,为什么,我们完成之后再去做分析考虑;
还是我之前说的,python 和 python3 要切换着用,因为情况乱,我并没有记录下所有的指令和报错信息,无法全部复现,所以大家要多尝试一下,因为我自己就是在 python、python3、python3.6 和 pip、pip3、
pip3.6 中来回切换才最终安装成功的,有时候python可以安装,但是它不能运行,python3可以运行,但是它不能安装;
(我安了2.7.5、3.6、3.7三个版本,我甚至在生产环境把自带的2.7.5卸载而导致yum和python均不能使用,害我一上午就在那修复了,闹死心了);
2、找不到模块:
    ##找不到模块,下面两种都可能出现,那么我们安装相应模块即可,但是一般正确安装了elastalert和dingtalk插件的基本不会提示;
    ##但也有特殊情况,我们的安装主要以python36为主,因为我们运行需要它,常用 pip3 来确定自己是不是真的没有安装包,还是只是它找不到路径

  File "/root/elastalert/elastalert/elastalert.py", line 21, in <module>
    import pytz
ImportError: No module named pytz

ModuleNotFoundError: No module named ‘deeptools‘
3、语法错误:
    ##语法错误其实是因为你自己的配置和使用的python和pip的版本问题,本身程序的代码没有问题,但是当python3的代码放到python2中那么就是语法错误,反之一样,这里展示的是我配置文件指向错误;
    ##你可能还会遇到一个问题,就是提示你a sync= False ,这个也是python3和2的使用错误,用3就会报错,这个是安装时候的提示,那么你直接用python,或python2.7就安装成功了

    raise EAException("Error querying for dashboard: %s" % (e)), None, sys.exc_info()[2]
                                                               ^
SyntaxError: invalid syntax
4、钉钉的模块找不到:
    ##仔细看里面: elastalert_modules.dingtalk_alert.DingTalkAlerter 找不到,之前说了,规则文件里面 alert 一定写对,而且 elastalert_modules 一定要复制到 elastalert 目录下

  File "/root/elastalert/elastalert/loaders.py", line 126, in load
    raise EAException(‘Error loading file %s: %s‘ % (rule_file, e))
elastalert.util.EAException: Error loading file ./example_rules/syslog200.yaml: Error initia
ting alert [‘elastalert_modules.dingtalk_alert.DingTalkAlerter‘]: Could not import module el
astalert_modules.dingtalk_alert.DingTalkAlerter: No module named ‘elastalert_modules‘
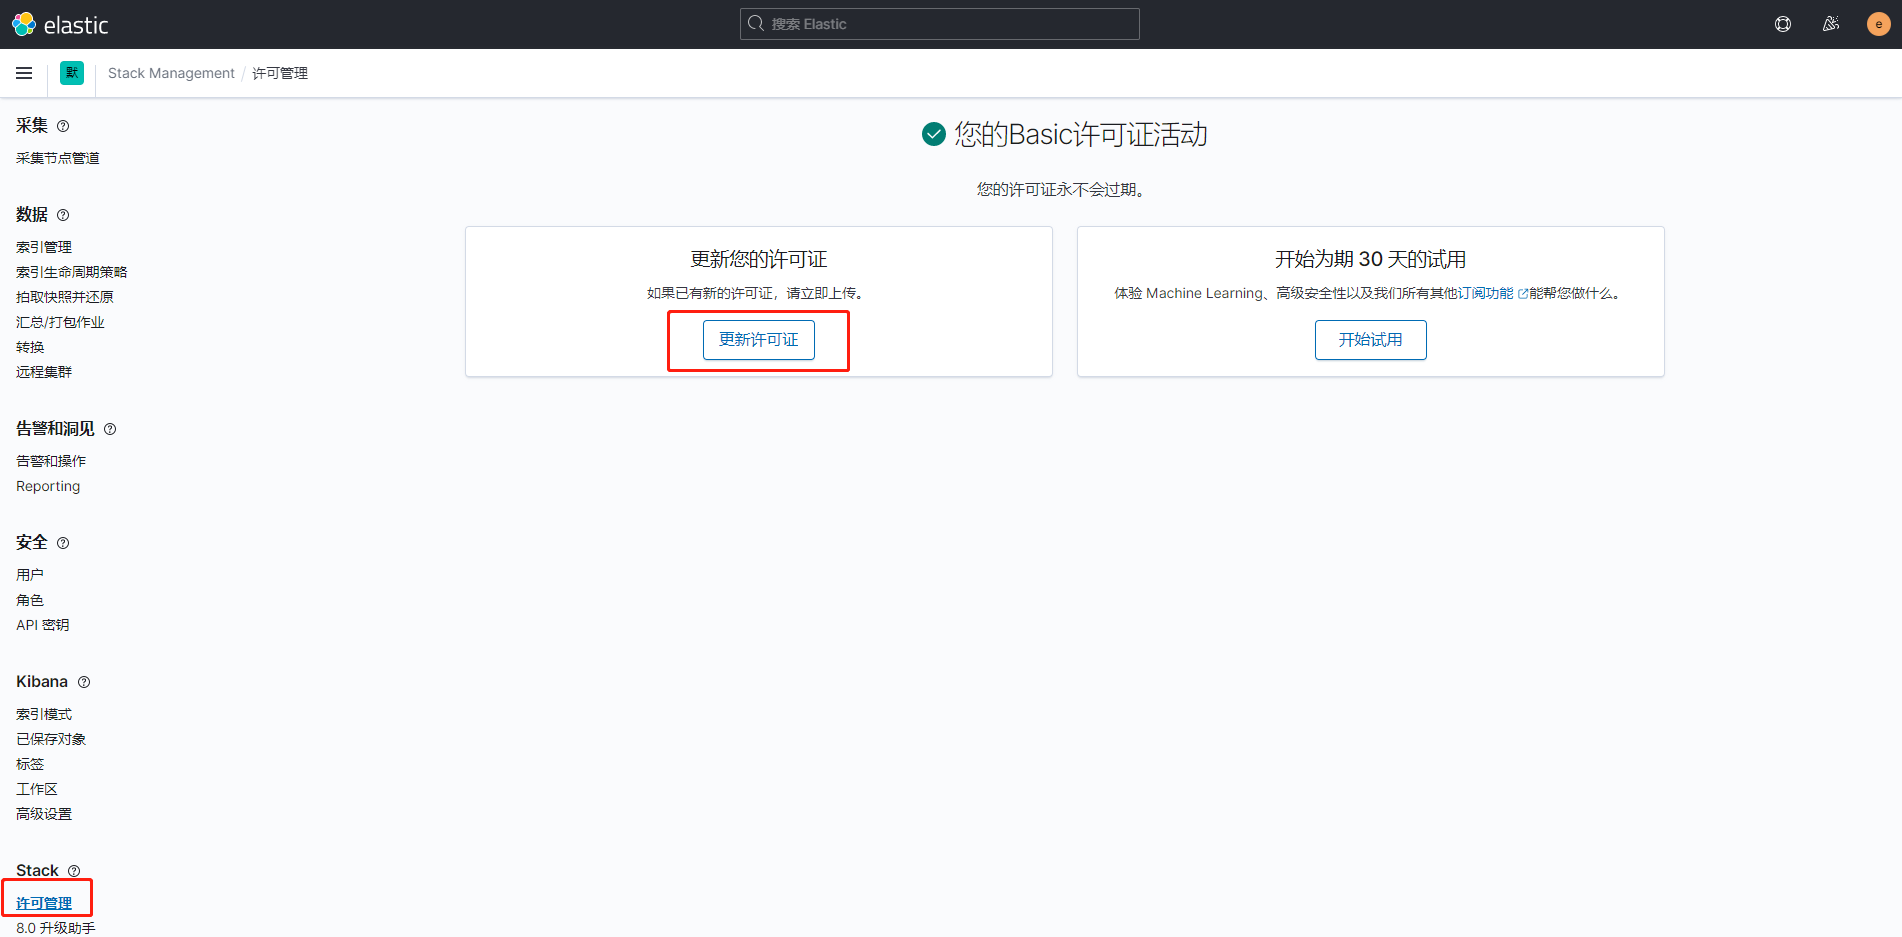
Kibana提示许可过期,不能对索引等功能进行操作
有的时候,会发生一些异常:我在测试的时候昨天晚上刚刚安装完,今天晚上用居然出现不能进行索引的相关你操作,提示我认证过期;
但是......,你不是说 “您的许可证永不会过期”,逗我?假的么?但是不管怎样,不能用了是真的,所以需要解决它;
许可证是可以在官网进行注册获取的,注册成功的邮件中有下载地址;但是问题也很奇怪,我反复的安装过很多次ELK,6.6.1、7.6.1、7.11.2,
这么多版本只有一次说我认证过期,而其他的测试,还有生产在用的都没有提示过我,不过既然出现过这种情况,可以解决,就没问题。
Elasticsearch与Kibana之间开启TLS以满足“告警和操作”的设置环境(商用功能)
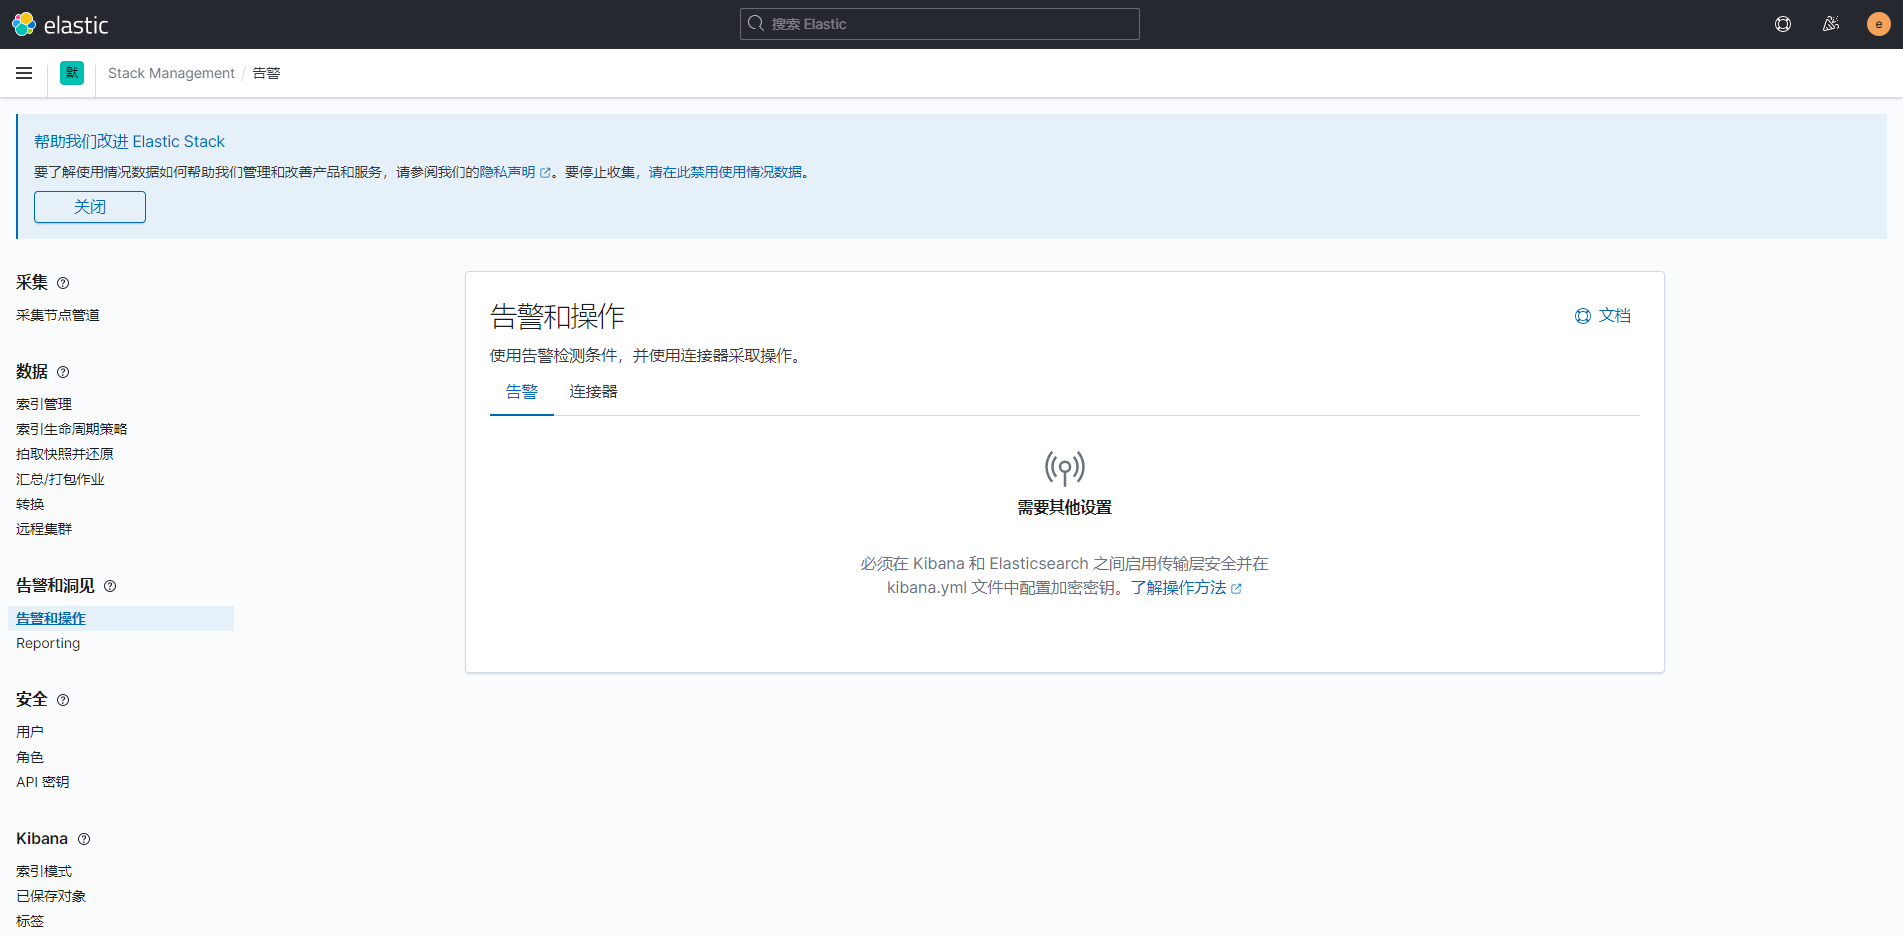
这个部分说来尴尬,其实当时是看到居然自带了“告警和操作”这个项目,以为可以使用,但是开启之后发现免费只有2个模块,想要用的webhook居然是商用,没办法,直接放弃转向了ElastAlert;
若你使用的是商用的各种会员(看看官方价格表,我就是没看商用功能的价格表,白忙活一天),可以使用这些商用功能,可以简单参考一下,来满足最基本的设置环境,详细的参考官方文档;
7.11.2中的”告警和操作“功能需要我们在为elasticsearch开启加密传输(E、L、K和filebeat都可以开启加密传输模式);
官方文档参考太多了,直接从他的页面点击进入去参考;最开始会提示你建立TLS,当你TLS建立完毕之后,会提示你需要API密钥;
配置错误会直接导致elasticsearch和kibana启动失败,使用 journalctl -xe 查看服务启动失败的原因进行调整即可,若是elasticsearch启动正常,但是提示kibana没有准备好,就是没有连接到elasticsearch,去看看http是否改了https;
elasticsearch服务一般启动慢,但是若是错误会提示,查看status也可以,但是kibana是一定要持续观察一下,因为kibana必定启动,但是不一定能一直正常运行,很可能启动成功,1、20秒后,status状态会变为失败,一定好好排查;
还有就是,当你配置完了,启动也正常了,但是依然不能访问kibana的时候,是因为你的kibana访问地址是https的,记得浏览器地址修改前缀;
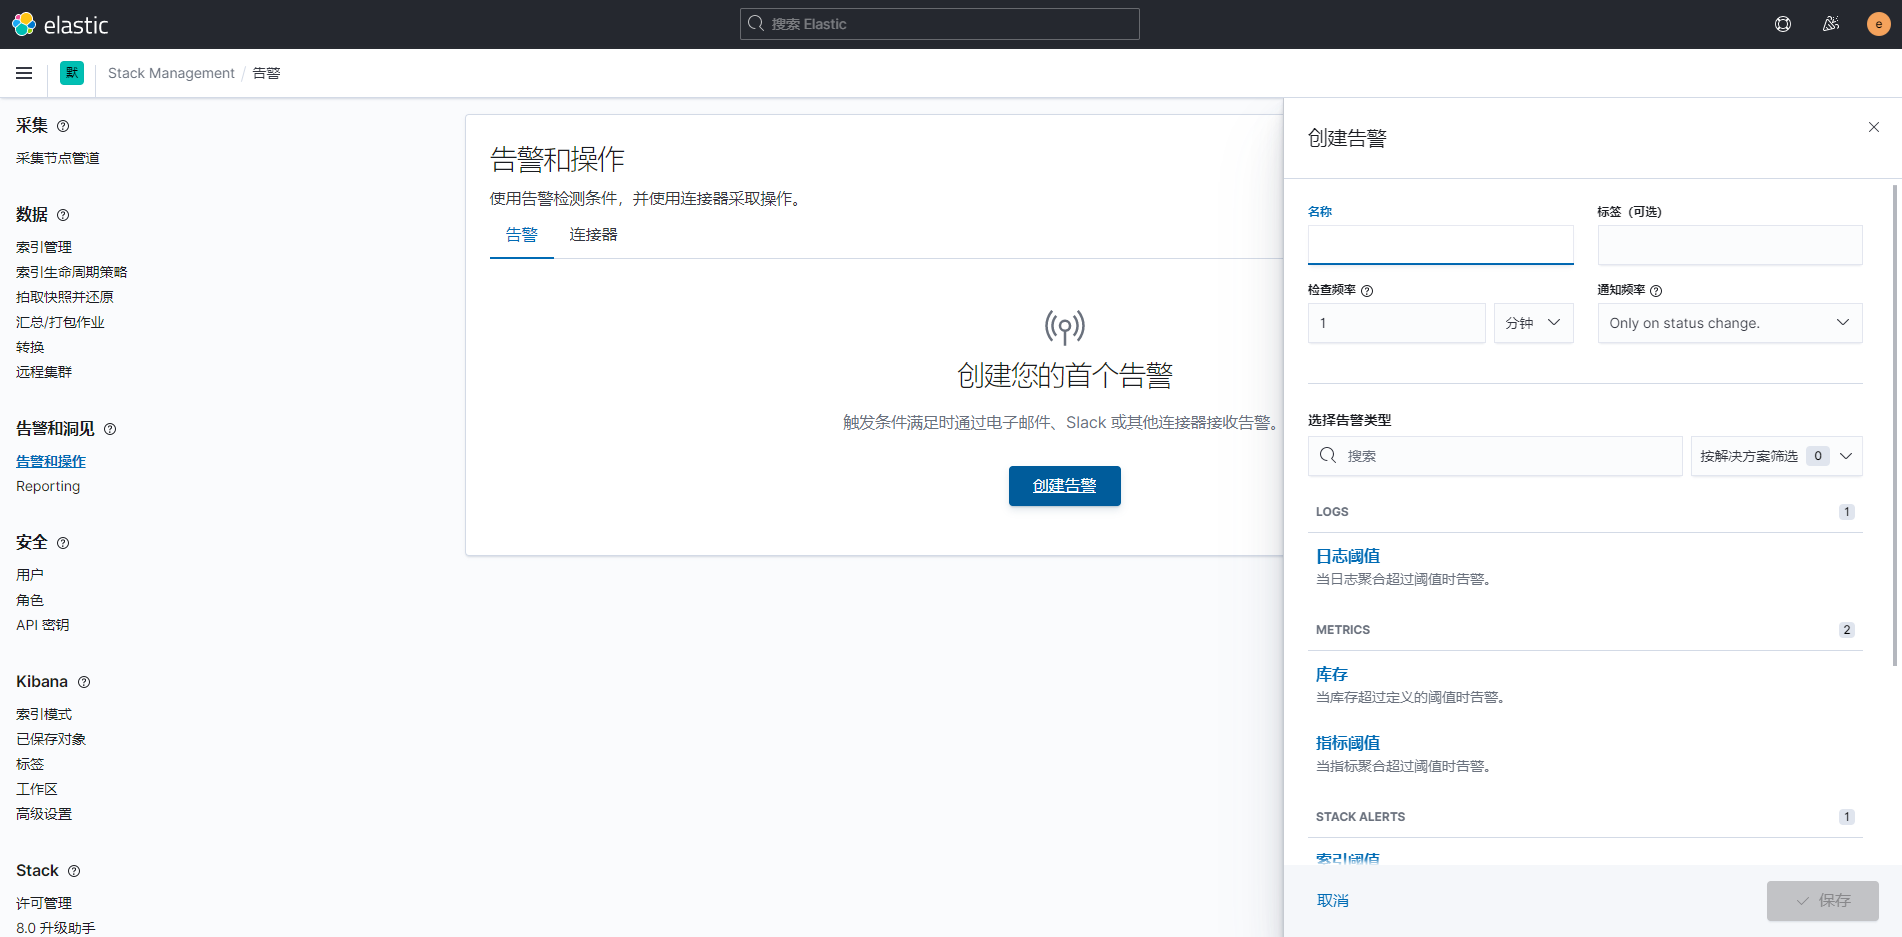
进入 ”告警和操作“ 的界面,我们首先是被告知:必须在 Kibana 和 Elasticsearch 之间启用传输层安全并在 kibana.yml 文件中配置加密密钥。那么我们接下来就对其进行配置:
按照我当前测试环境的配置,需要的文件如下,有了这些文件就可以开启Elasticsearch和Kibana直接的安全传输了;
当然我的列表里面有很多是原来的配置文件,记得区分:
Elasticsearch需要
[root@VM_0_7_centos elasticsearch]# pwd
/etc/elasticsearch
[root@VM_0_7_centos elasticsearch]# ll
total 76
-rw------- 1 elasticsearch root           3443 Apr  6 10:51 elastic-certificates.p12
-rw-rw---- 1 root          elasticsearch   199 Mar 29 18:04 elasticsearch.keystore
-rw-rw---- 1 root          elasticsearch  3545 Apr  6 09:14 elasticsearch.yml
-rw------- 1 elasticsearch root           2527 Apr  6 10:51 elastic-stack-ca.p12
-rw-r--r-- 1 elasticsearch root           3451 Apr  6 11:01 http.p12
-rw-rw---- 1 root          elasticsearch  3182 Mar  6 14:03 jvm.options
drwxr-s--- 2 root          elasticsearch  4096 Mar  6 14:06 jvm.options.d
-rw-r--r-- 1 root          elasticsearch  1397 Apr  6 11:36 kibana-ca.crt
-rw-rw---- 1 root          elasticsearch 18612 Mar  6 14:03 log4j2.properties
-rw-r--r-- 1 root          root           1306 Apr  6 11:01 README.txt
-rw-rw---- 1 root          elasticsearch   473 Mar  6 14:03 role_mapping.yml
-rw-rw---- 1 root          elasticsearch   197 Mar  6 14:03 roles.yml
-rw-r--r-- 1 root          root            658 Apr  6 11:01 sample-elasticsearch.yml
-rw-r--r-- 1 root          root           1057 Apr  6 11:01 sample-kibana.yml
-rw-rw---- 1 root          elasticsearch     0 Mar  6 14:03 users
-rw-rw---- 1 root          elasticsearch     0 Mar  6 14:03 users_roles
Kibana需要
[root@VM_0_7_centos elasticsearch]# cd /etc/kibana/
[root@VM_0_7_centos kibana]# ll
total 20
-rw-r--r-- 1 kibana root   1200 Apr  6 11:08 elasticsearch-ca.pem
-rw-rw---- 1 root   kibana 5466 Apr  6 11:53 kibana.yml
-rw-r--r-- 1 root   kibana  216 Mar  6 13:11 node.options
然后我们根据我们的需要去生成文件:
生成CA证书:
[root@localhost ~]# /usr/share/elasticsearch/bin/elasticsearch-certutil ca
This tool assists you in the generation of X.509 certificates and certificate
signing requests for use with SSL/TLS in the Elastic stack.
  ......
  ......

be a zip file containing individual files for the CA certificate and private key

Please enter the desired output file [elastic-stack-ca.p12]:  默认即可,直接回车确定
Enter password for elastic-stack-ca.p12 : 可自行设定密码,不设定直接回车也可以

    ##查看生成文件
[root@localhost ~]# ls -l /usr/share/elasticsearch/elastic-stack-ca.p12
-rw------- 1 root root 2527 Apr  5 13:38 /usr/share/elasticsearch/elastic-stack-ca.p12
生成节点的证书及私钥:
[root@localhost ~]# /usr/share/elasticsearch/bin/elasticsearch-certutil cert --ca /usr/share/elasticsearch/elastic-stack-ca.p12
This tool assists you in the generation of X.509 certificates and certificate
signing requests for use with SSL/TLS in the Elastic stack.
  ......
  ......

    * -keep-ca-key (retain generated CA key)
    * -multiple (generate multiple certificates)
    * -in (generate certificates from an input file)
then the output will be be a zip file containing individual certificate/key files

Enter password for CA (/usr/share/elasticsearch/elastic-stack-ca.p12) :  指定好的文件,直接回车即可
Please enter the desired output file [elastic-certificates.p12]:  直接回车
Enter password for elastic-certificates.p12 :  直接回车

Certificates written to /usr/share/elasticsearch/elastic-certificates.p12

  ......
  ......

configure the client to trust this certificate.

    ##查看生成的文件
[root@localhost ~]# ls -l /usr/share/elasticsearch/elastic-certificates.p12
-rw------- 1 root root 3451 Apr  5 13:41 /usr/share/elasticsearch/elastic-certificates.p12
Elasticsearch加密HTTP客户端通信:
[root@localhost ~]# /usr/share/elasticsearch/bin/elasticsearch-certutil http

## Elasticsearch HTTP Certificate Utility

The ‘http‘ command guides you through the process of generating certificates
  ......
  ......
configure all your clients to trust that custom CA.

Generate a CSR? [y/N] n 输入n,选否

## Do you have an existing Certificate Authority (CA) key-pair that you wish to use to sign your certificate?

If you have an existing CA certificate and key, then you can use that CA to
sign your new http certificate. This allows you to use the same CA across
multiple Elasticsearch clusters which can make it easier to configure clients,
and may be easier for you to manage.

If you do not have an existing CA, one will be generated for you.

Use an existing CA? [y/N] y 输入y,选是

## What is the path to your CA?

Please enter the full pathname to the Certificate Authority that you wish to
use for signing your new http certificate. This can be in PKCS#12 (.p12), JKS
(.jks) or PEM (.crt, .key, .pem) format.
CA Path: /usr/share/elasticsearch/elastic-stack-ca.p12  这个是我们之前生成的文件
Reading a PKCS12 keystore requires a password.
It is possible for the keystore‘s password to be blank,
in which case you can simply press <ENTER> at the prompt
Password for elastic-stack-ca.p12: 直接回车

## How long should your certificates be valid?

Every certificate has an expiry date. When the expiry date is reached clients
will stop trusting your certificate and TLS connections will fail.

Best practice suggests that you should either:
(a) set this to a short duration (90 - 120 days) and have automatic processes
to generate a new certificate before the old one expires, or
(b) set it to a longer duration (3 - 5 years) and then perform a manual update
a few months before it expires.

You may enter the validity period in years (e.g. 3Y), months (e.g. 18M), or days (e.g. 90D)

For how long should your certificate be valid? [5y]  这里是有效时间,Y是年,M是月,D是天,根据实际情况写,默认5Y,我直接回车了

## Do you wish to generate one certificate per node?

If you have multiple nodes in your cluster, then you may choose to generate a
separate certificate for each of these nodes. Each certificate will have its
own private key, and will be issued for a specific hostname or IP address.

Alternatively, you may wish to generate a single certificate that is valid
across all the hostnames or addresses in your cluster.

If all of your nodes will be accessed through a single domain
(e.g. node01.es.example.com, node02.es.example.com, etc) then you may find it
simpler to generate one certificate with a wildcard hostname (*.es.example.com)
and use that across all of your nodes.

However, if you do not have a common domain name, and you expect to add
additional nodes to your cluster in the future, then you should generate a
certificate per node so that you can more easily generate new certificates when
you provision new nodes.

Generate a certificate per node? [y/N] n 这里我选择不为每个节点设置,因为我是单机配置,若是集群,需要每个去配置,然后分发文件

## Which hostnames will be used to connect to your nodes?

These hostnames will be added as "DNS" names in the "Subject Alternative Name"
(SAN) field in your certificate.

You should list every hostname and variant that people will use to connect to
your cluster over http.
Do not list IP addresses here, you will be asked to enter them later.

If you wish to use a wildcard certificate (for example *.es.example.com) you
can enter that here.

Enter all the hostnames that you need, one per line.
When you are done, press <ENTER> once more to move on to the next step.
这里提示我直接回车,不填写主机的hostname,因为我是单机

You did not enter any hostnames.
Clients are likely to encounter TLS hostname verification errors if they
connect to your cluster using a DNS name.

Is this correct [Y/n]y 是否使用当前配置,选择y是

## Which IP addresses will be used to connect to your nodes?

If your clients will ever connect to your nodes by numeric IP address, then you
can list these as valid IP "Subject Alternative Name" (SAN) fields in your
certificate.

If you do not have fixed IP addresses, or not wish to support direct IP access
to your cluster then you can just press <ENTER> to skip this step.

Enter all the IP addresses that you need, one per line.
When you are done, press <ENTER> once more to move on to the next step.

192.168.85.10 这里输入本机的IP地址,回车一次,输入一条,然后再点回车确定即可

You entered the following IP addresses.

 - 192.168.85.10

Is this correct [Y/n]y 是否使用当前配置,选择y是

## Other certificate options

The generated certificate will have the following additional configuration
values. These values have been selected based on a combination of the
information you have provided above and secure defaults. You should not need to
change these values unless you have specific requirements.

Key Name: elasticsearch
Subject DN: CN=elasticsearch
Key Size: 2048

Do you wish to change any of these options? [y/N]n 是否要修改之前的选择,选n否,我们配置没有问题就可以

## What password do you want for your private key(s)?

Your private key(s) will be stored in a PKCS#12 keystore file named "http.p12".
This type of keystore is always password protected, but it is possible to use a
blank password.

If you wish to use a blank password, simply press <enter> at the prompt below.
Provide a password for the "http.p12" file:  [<ENTER> for none]
根据提示,回车就可以了,我们的配置已经完成,之后只是提示和生成文件了

## Where should we save the generated files?

A number of files will be generated including your private key(s),
public certificate(s), and sample configuration options for Elastic Stack products.

These files will be included in a single zip archive.

What filename should be used for the output zip file? [/usr/share/elasticsearch/elasticsearch-ssl-http.zip]

Zip file written to /usr/share/elasticsearch/elasticsearch-ssl-http.zip

    ##生成的文件是zip格式的,若没有unzip,请yum install -y unzip
[root@localhost ~]# unzip /usr/share/elasticsearch/elasticsearch-ssl-http.zip -d /root
Archive:  /usr/share/elasticsearch/elasticsearch-ssl-http.zip
   creating: /root/elasticsearch/
  inflating: /root/elasticsearch/README.txt
  inflating: /root/elasticsearch/http.p12
  inflating: /root/elasticsearch/sample-elasticsearch.yml
   creating: /root/kibana/
  inflating: /root/kibana/README.txt
  inflating: /root/kibana/elasticsearch-ca.pem
  inflating: /root/kibana/sample-kibana.yml
调整Elasticsearch的配置文件:
[root@localhost ~]# vim /etc/elasticsearch/elasticsearch.yml

    ##在最后面添加即可,文件的path是相对路径,是放到了/etc/elasticsearch下才可行
 92 xpack.security.transport.ssl.verification_mode: certificate
 93 xpack.security.transport.ssl.client_authentication: required
 94 xpack.security.transport.ssl.keystore.path: elastic-certificates.p12
 95 xpack.security.transport.ssl.truststore.path: elastic-certificates.p12
 96 xpack.security.http.ssl.enabled: true
 97 xpack.security.http.ssl.keystore.path: http.p12
调整Kibana的配置文件:
[root@localhost ~]# vim /etc/kibana/kibana.yml

    ##开启了SSL,所以elasticsearch的访问地址已经变成了https了
 32 elasticsearch.hosts: ["https://192.168.85.10:9200"]

    ##下面直接添加一个elasticsearch的ca证书,指向文件位置
 34 elasticsearch.ssl.certificateAuthorities: [ "/etc/kibana/elasticsearch-ca.pem" ]

    ##直接在结尾添加就可以,字符串是随机自定义的就可以,至少32位,下面是kibana的会话超时时间和生命周期
118 xpack.encryptedSavedObjects.encryptionKey: ‘afdjlk_@rsedfdgnfkl_asd_flkfjselj_faelikj@##‘
119 xpack.security.session.idleTimeout: "1h"
120 xpack.security.session.lifespan: "30d"
再次访问 ”告警和操作“ ,可以看到已经可以建立告警了:
下面内容是 filebeat 和 logstash 的相关设置,毕竟 http:// 已经连接不上了;
这里说明一下,我这里配置只是为了能够设置告警,而只开了elasticsearch和kibana相关的配置;
但本身没有开logstash和filebeat的HTTPS,所以,它们只需要可以连接到开启HTTPS的elasticsearch和kibana即可;
若你需要将全部应用的服务均开启安全传输,那么请参考官网:https://www.elastic.co/guide/en/elasticsearch/reference/7.11/ssl-tls.html
filebeat 配置文件有两种方法:
第一种需要将原来的http改为https,并增加一个CA证书;
[root@postgreSQL ~]# vim /etc/filebeat/filebeat.yml
    ##Elasticsearch Output部分的hosts给地址加上https://即可
  hosts: ["https://192.168.85.10:9200"]

    ##文件是来自elasticsearch的主机的CA证书,权限root即可
  ssl.certificate_authorities: ["/etc/filebeat/elasticsearch-ca.pem"]
第二种需要在原来 output.elasticsearch 加两个选项;
[root@postgreSQL ~]# vim /etc/filebeat/filebeat.yml
    ##在Elasticsearch Output部分添加这两行,使用https
  protocol: "https"
  ssl.verification_mode: none

    ##之后重启服务
[root@postgreSQL ~]# systemctl restart filebeat
没有报错,服务状态正常,去 Kibana 的可视化界面验证下是否刷新日志;
logstash 配置文件:
    ##首先需要CA证书,这里仿照Kibana的方法可以生成p12文件
[root@localhost ~]# /usr/share/elasticsearch/bin/elasticsearch-certutil cert -ca /etc/elasticsearch/elastic-stack-ca.p12 -name logstash-client
This tool assists you in the generation of X.509 certificates and certificate
signing requests for use with SSL/TLS in the Elastic stack.
  ......
  ......

    * -multiple (generate multiple certificates)
    * -in (generate certificates from an input file)
then the output will be be a zip file containing individual certificate/key files

Enter password for CA (/etc/elasticsearch/elastic-stack-ca.p12) :  直接回车
Please enter the desired output file [logstash-client.p12]:  还是回车
Enter password for logstash-client.p12 :  依旧回车

  ......
  ......

configure the client to trust this certificate.

    ##根据生成的p12文件,生成我们需要的CA证书
[root@localhost ~]# openssl pkcs12 -in /usr/share/elasticsearch/logstash-client.p12  -cacerts -nokeys -out logstash-ca.crt
Enter Import Password:
MAC verified OK

    ##之后文件放入logstash的配置文件目录,权限原来的root即可,不用修改
[root@localhost ~]# mv logstash-ca.crt /etc/logstash/
修改配置文件:
[root@localhost ~]# vim /etc/logstash/conf.d/logstash.conf
# Sample Logstash configuration for creating a simple
# Beats -> Logstash -> Elasticsearch pipeline.

input {
  beats {
    port => 5044
  }
}

output {
  elasticsearch {
    hosts => ["https://192.168.180.200:9200"]
    ##开启ssl
    ssl => true
    ##指定刚才我们生成的CA证书文件
    cacert => "/etc/logstash/logstash-ca.crt"
    index => "%{[fields][index]}-%{[@metadata][beat]}-%{+YYYY.MM.dd}"
    user => "elastic"
    password => "elastic"
  }
}
之后我们启动(或重启)logstash 和 filebeat 服务,然后到Kibana可视化界面查看是否刷新了日志;
相应的,filebeat 服务的配置文件是无需修改的;
希望有帮到你,哈哈!