python绘图
时间:2020-07-18 01:00:10
收藏:0
阅读:87
最简绘图代码
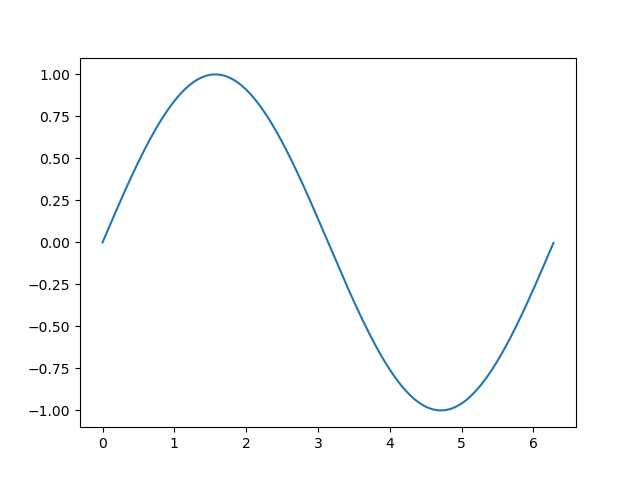
import numpy as np
import matplotlib.pyplot as plt
x = np.arange(0, 2*np.pi, 0.01)
y = np.sin(x)
plt.figure(1)
plt.plot(x, y)
plt.show()
绘图效果
评论(0)