matplotlib.pyplot.subplots_adjust
时间:2020-02-01 12:26:35
收藏:0
阅读:186
调整子图布局,调用格式如下:
subplots_adjust(left=None, bottom=None, right=None, top=None, wspace=None, hspace=None)
参数
有六个可选参数来控制子图布局。值均为0~1之间。其中left、bottom、right、top围成的区域就是子图的区域。wspace、hspace分别表示子图之间左右、上下的间距。实际的默认值由matplotlibrc文件控制的。
简单示例
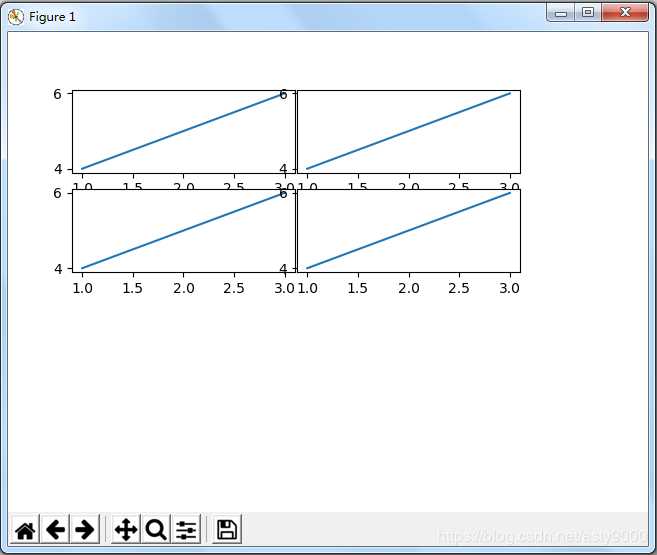
import matplotlib.pyplot as plt

x=[1,2,3]
y=[4,5,6]
fig, axs = plt.subplots(2, 2)
axs[0, 0].plot(x,y)
axs[0, 1].plot(x,y)
axs[1, 0].plot(x,y)
axs[1, 1].plot(x,y)

plt.subplots_adjust(left=0.1, bottom=0.5, right=0.8, wspace=0.01)

plt.show()
运行结果如下:
评论(0)