python可视化---scatter()函数
时间:2019-02-28 16:35:53
收藏:0
阅读:1450
函数功能:寻找变量之间的关系。
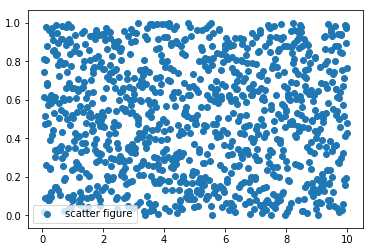
调用签名:plt.scatter(x, y, c="b", label="scatter figure")
x: x轴上的数值
y: y轴上的数值
c:散点图中的标记的颜色
label:标记图形内容的标签文本
代码实现:
import matplotlib.pyplot as plt
import numpy as np

x = np.linspace(0.05, 10, 1000)
y = np.random.rand(1000)

plt.scatter(x, y, label="scatter figure")

plt.legend()

plt.show()
评论(0)