Python Pandas 时间序列双轴折线图
时间:2018-05-13 15:05:38
收藏:0
阅读:1450
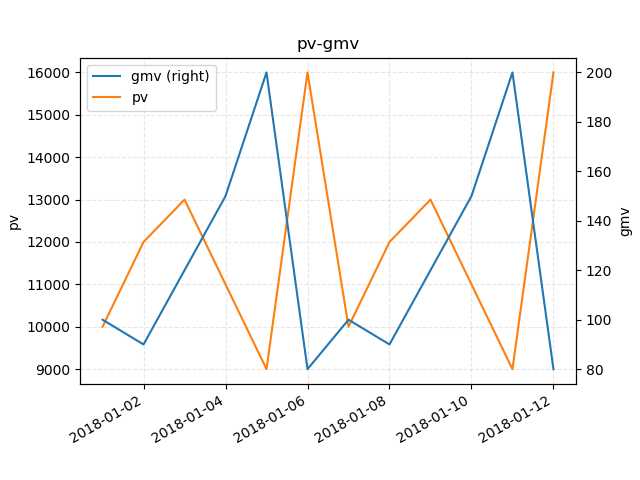
时间序列pv-gmv双轴折线图
import numpy as np
import pandas as pd
import matplotlib.pyplot as plt

n = 12
date_series = pd.date_range(start=‘2018-01-01‘, periods=n, freq="D")

data = {
    ‘pv‘: [10000, 12000, 13000, 11000, 9000, 16000, 10000, 12000, 13000, 11000, 9000, 16000],
    ‘gmv‘: [100, 90, 120, 150, 200, 80, 100, 90, 120, 150, 200, 80]
}

df = pd.DataFrame(data, index=date_series)

ax = df.plot(
    secondary_y=[‘gmv‘],
    x_compat=True,
    grid=True)

ax.set_title("pv-gmv")
ax.set_ylabel(‘pv‘)
ax.grid(linestyle="--", alpha=0.3)

ax.right_ax.set_ylabel(‘gmv‘)

plt.show()
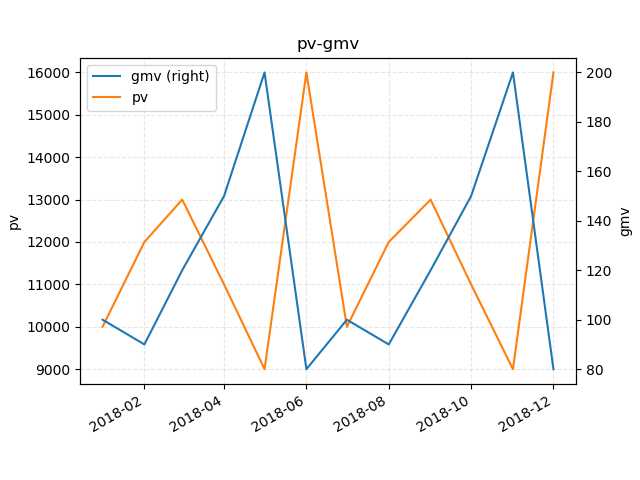
import math
import numpy as np
import pandas as pd
import matplotlib.pyplot as plt

n = 12
date_series = pd.period_range(start=‘2018-01‘, periods=n, freq="M")

data = {
    ‘pv‘: [10000, 12000, 13000, 11000, 9000, 16000, 10000, 12000, 13000, 11000, 9000, 16000],
    ‘gmv‘: [100, 90, 120, 150, 200, 80, 100, 90, 120, 150, 200, 80]
}

df = pd.DataFrame(data, index=date_series)

ax = df.plot(
    secondary_y=[‘gmv‘],
    x_compat=True,
    grid=True)

ax.set_title("pv-gmv")
ax.set_ylabel(‘pv‘)
ax.grid(linestyle="--", alpha=0.3)


ax.right_ax.set_ylabel(‘gmv‘)

plt.show()
评论(0)