Python - Seaborn可视化:图形个性化设置的几个小技巧
时间:2017-08-23 20:50:25
收藏:0
阅读:22209
1 概述
在可视化过程中,经常会对默认的制图效果不满意,希望能个性化进行各种设置。
本文通过一个简单的示例,来介绍seaborn可视化过程中的个性化设置。包括常用的设置,如:
- 设置图表显示颜色
- 设置图表标题,包括显示位置,字体大小,颜色等
- 设置x轴和y轴标题,包括颜色,字体大小
- 设置x轴和y轴刻度内容,包括颜色、字体大小、字体方向等
- 将x轴和y轴内容逆序显示
- 设置x轴或y轴显示位置
本文的运行环境:
- windows 7
- python 3.5
- jupyter notebook
- seaborn 0.7.1
- matplotlib 2.0.2
2 未个性化设置的情形
本文的数据来自UCI的数据集”sonar”,用pandas直接读取数据。如下:
import pandas as pd
import matplotlib.pyplot as plt
import seaborn as sns
% matplotlib inline

target_url = ‘http://archive.ics.uci.edu/ml/machine-learning-databases/undocumented/connectionist-bench/sonar/sonar.all-data‘
df = pd.read_csv(target_url, header=None, prefix=‘V‘)
corr = df.corr()
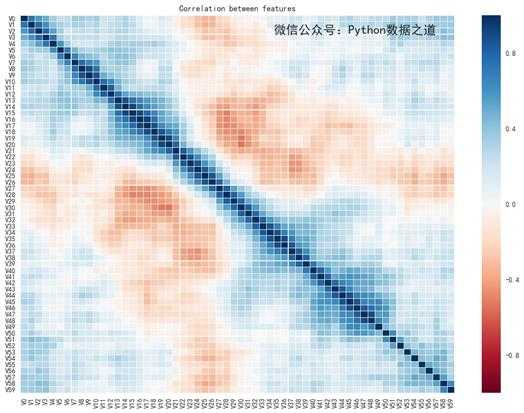
首先来看看没有进行个性化设置时的显示情况,如下:
f, ax= plt.subplots(figsize = (14, 10))

sns.heatmap(corr,cmap=‘RdBu‘, linewidths = 0.05, ax = ax)

# 设置Axes的标题
ax.set_title(‘Correlation between features‘)

f.savefig(‘sns_style_origin.jpg‘, dpi=100, bbox_inches=‘tight‘)
图片显示效果如下:

seaborn制图的默认效果其实还是不错的。
3 进行个性化设置
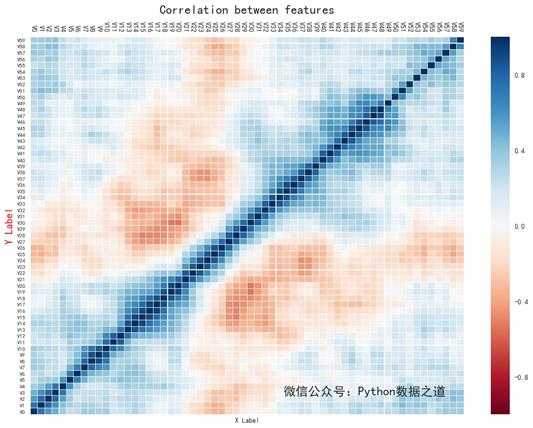
对于上面这张图,可能让y轴从下到上,从v0开始显示,这样显示出来的对角线可能更符合我们的视觉显示效果。
这就要用到 将y轴内容进行可逆显示,涉及的代码如下:
# 将y轴或x轴进行逆序
ax.invert_yaxis()
# ax.invert_xaxis()
其他的个性化设置的代码,包括:
将x轴刻度放置在top位置的几种方法
# 将x轴刻度放置在top位置的几种方法
# ax.xaxis.set_ticks_position(‘top‘)
ax.xaxis.tick_top()
# ax.tick_params(axis=‘x‘,labelsize=6, colors=‘b‘, labeltop=True, labelbottom=False) # x轴
设置坐标轴刻度参数,”axis”不写的时候,默认是x轴和y轴的参数同时调整。
# 设置坐标轴刻度的字体大小
# matplotlib.axes.Axes.tick_params
ax.tick_params(axis=‘y‘,labelsize=8) # y轴
旋转轴刻度上文字方向的两种方法
# 旋转轴刻度上文字方向的两种方法
ax.set_xticklabels(ax.get_xticklabels(), rotation=-90)
# ax.set_xticklabels(corr.index, rotation=90)
保存图片,设置bbox_inches=’tight’,保存的图片则不会出现部分内容显示不全的现象。
f.savefig(‘sns_style_update.jpg‘, dpi=100, bbox_inches=‘tight‘)
整合好的代码如下,大家可以运行试试效果。
f, ax = plt.subplots(figsize = (14, 10))

# 设置颜色
cmap = sns.cubehelix_palette(start = 1, rot = 3, gamma=0.8, as_cmap = True)

# color: https://matplotlib.org/users/colormaps.html
sns.heatmap(corr,cmap=‘RdBu‘, linewidths = 0.05, ax = ax)

# 设置Axes的标题
ax.set_title(‘Correlation between features‘, fontsize=18, position=(0.5,1.05))

# 将y轴或x轴进行逆序
ax.invert_yaxis()
# ax.invert_xaxis()

ax.set_xlabel(‘X Label‘,fontsize=10)

# 设置Y轴标签的字体大小和字体颜色
ax.set_ylabel(‘Y Label‘,fontsize=15, color=‘r‘)

# 设置坐标轴刻度的字体大小
# matplotlib.axes.Axes.tick_params
ax.tick_params(axis=‘y‘,labelsize=8) # y轴
# ax.tick_params(axis=‘x‘,labelsize=6, colors=‘b‘, labeltop=True, labelbottom=False) # x轴

# 将x轴刻度放置在top位置的几种方法
# ax.xaxis.set_ticks_position(‘top‘)
ax.xaxis.tick_top()
# ax.tick_params(axis=‘x‘,labelsize=6, colors=‘b‘, labeltop=True, labelbottom=False) # x轴

# 修改tick的字体颜色
# ax.tick_params(axis=‘x‘, colors=‘b‘) # x轴

# 旋转轴刻度上文字方向的两种方法
ax.set_xticklabels(ax.get_xticklabels(), rotation=-90)
# ax.set_xticklabels(corr.index, rotation=90)

# 单独设置y轴或x轴刻度的字体大小, 调整字体方向
# ax.set_yticklabels(ax.get_yticklabels(),fontsize=6)
# ax.set_xticklabels(ax.get_xticklabels(), rotation=-90)

f.savefig(‘sns_style_update.jpg‘, dpi=100, bbox_inches=‘tight‘)
图形显示效果如下:

这些个性化的设置,其实大部分都是使用的matplotlib的内容,seaborn是基于matplotlib衍生的,所以可以跟matplotlib进行融合使用。
当然,并不是每次都需要进行个性定制,具体可以根据自己的需求来设置。
如果您喜欢我的文章,欢迎关注微信公众号“Python数据之道”(ID:PyDataRoad)
评论(0)
